Introduction
YOU MADE IT!!!! Welcome to the final section in all of AP Micro. That's right, you've fought through utility maximization, supply and demand, perfect competition, monopolies, game theory, labor markets, externalities, and now you're at the final section!

This last unit is a quite small one, but is integral to your full understanding of how markets can fail. This section covers one of the biggest ways the free market fails: inequality. This whole course we've discussed how markets can fail by underproducing or overproducing, but we haven't yet looked at the very real reality that markets also lead to extremely unequal societies. This guide will discuss how we measure inequality by using a model called the Lorenz Curve and discuss different tax structures that help to mitigate inequality and make people pay their fair share. Unfortunately, there's no end all be all solution for inequality and it's a problem that exists in all economies. Without further ado, let's jump into it!

Types of Inequality
There are two types of economic inequality: (1) income inequality, and (2) wealth inequality. Income inequality looks at how annual earnings are distributed and wealth inequality looks at how assets are distributed. There are several sources of these two types of inequality, including abilities/human capital, social capital, inheritance, effects of discrimination, access to financial markets, mobility, and bargaining power within economic and social units.
The Lorenz Curve
We use a graph known as the Lorenz Curve to graphically represent income inequality. The Gini Coefficient is a numerical measurement of income inequality. It is a statistical measurement of income equality where perfect equality is 0 and perfect inequality is 1. The government can help with income inequality by either increasing the amount it taxes wealthier citizens or by increasing transfer payments to the poor. Transfer payments are government payments to individuals or businesses designed to meet a specific objective rather than pay for goods or resources (Ex: welfare).

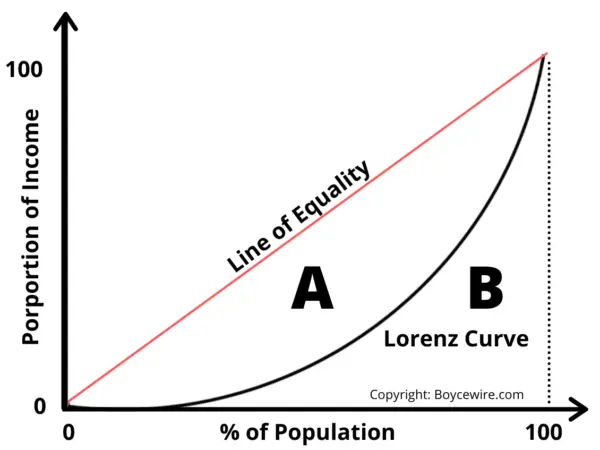
The Lorenz curve shows the actual income distribution in a society. The larger the gap between perfect equality and the Lorenz curve, the greater the amount of income inequality that exists. For example, here's a Lorenz Curve for different levels of inequality:

We can use the Lorenz curve to calculate the Gini Coefficient for a society. The Gini Coefficient is the ratio of A to the total area under the equality line. Mathematically, that is to say: Gini Coefficient = A / (A + B). A higher value of the Gini Coefficient implies higher inequality, since this means the Lorenz Curve is much steeper.
Here's a map of the Gini Coefficient across the world. The world average Gini Coefficient is between 0.61 and 0.68.

Types of Taxes
There are several types of taxes that can contribute to or help with income inequality. 💸
- Progressive taxes take a larger percentage of income from high-income groups than from low-income groups. The most common example of a progressive tax is the Federal Income Tax System in the United States. This system divides people into tax brackets based on their income level, and taxes people increasing amounts as income increases. To demonstrate, someone making between $0 and $14,100 this year is taxed 10% of that income, while someone making between $14,101 and $53,700 this year is taxed 12% of that income.
- Regressive taxes take a larger percentage from low-income groups than from high-income groups. The most common example of a regressive tax is sales tax in the United States. Let's say the sales tax is 5% in a state, and Sally and Bob both spend $200 in sales taxes. Sally only makes $10,000 a year, so this $200 takes a larger percentage of her income than Bob, who makes $100,000 a year. Although this sales tax is the same for everyone, someone in a low-income group will feel the burden of this tax more than someone in a high-income group. It's important to note that a flat tax is actually regressive! This is because proportionally, lower-income groups pay a higher percentage of their income compared to high-income groups. For example, suppose everyone had to pay $100 in taxes every year. Someone making $1000 a year pays 10% income tax, whereas someone making $10000 per year only pays a 1% income tax.
- Proportional taxes takes the same percentage of income from all income groups. For example, if there was a 20% flat income tax on all income groups, each income group is equally affected by the tax. This would mean making $100 taxes you $20 and making $1000 taxes you $200.
Frequently Asked Questions
What is income inequality and how is it different from wealth inequality?
Income inequality is the unequal distribution of earnings—wages, salaries, interest, rent, and profits—across people or groups. Wealth inequality is the unequal distribution of accumulated assets (savings, stocks, bonds, real estate, inheritance). Key differences: income is a flow you get each year; wealth is a stock built over time and can generate more income (so wealth inequality often magnifies income inequality). On the AP CED you’ll use tools like the Lorenz curve and Gini coefficient to describe inequality (you won’t need to draw or calculate them on the exam). Sources of both include differences in the marginal product of labor/capital, human and social capital, inheritance, tax structure (progressive vs. regressive), discrimination, access to credit, mobility, and bargaining power (CED EK POL-5.B.1–.2). For a targeted review, see the Topic 6.5 study guide (https://library.fiveable.me/ap-microeconomics/unit-6/inequality/study-guide/rmL71WEQFiM4gxDOnFca) and more unit review (https://library.fiveable.me/ap-microeconomics/unit-6). For practice, try the AP problems collection (https://library.fiveable.me/practice/ap-microeconomics).
How do I read a Lorenz curve and what does it show about inequality?
The Lorenz curve graphs the cumulative share of income (or wealth) on the vertical axis against the cumulative share of people (from poorest to richest) on the horizontal axis. The 45° line (line of equality) means perfect equality: x% of people have x% of income. The Lorenz curve bows below that line; the more it bows, the more unequal the distribution. So if one country’s Lorenz curve lies consistently closer to the diagonal than another’s, that country is more equal. The Gini coefficient summarizes inequality by measuring the area between the Lorenz curve and the line of equality (larger area = higher Gini = more inequality). Note: per the CED, you should understand what the Lorenz curve and Gini show, but drawing Lorenz curves and calculating Gini coefficients are beyond AP exam tasks (EK POL-5.A.2). For a quick topic review, see the unit study guide (https://library.fiveable.me/ap-microeconomics/unit-6/inequality/study-guide/rmL71WEQFiM4gxDOnFca) and more practice problems (https://library.fiveable.me/practice/ap-microeconomics).
What's the Gini coefficient and why do economists use it to measure inequality?
The Gini coefficient is a single-number measure of income (or wealth) inequality that comes from the Lorenz curve. The Lorenz curve plots cumulative income share against cumulative population; the Gini is the ratio of the area between the line of perfect equality and the Lorenz curve to the total area under the equality line. It ranges from 0 (perfect equality) to 1 (perfect inequality)—sometimes shown as 0–100. Economists use it because it summarizes a whole distribution in one comparable number, so you can track inequality across countries, policies, or time. Limitations: it doesn’t show where inequality occurs (top vs. middle), or say anything about poverty levels, and different distributions can have the same Gini. (Note: the AP CED says drawing Lorenz curves and calculating Gini coefficients is beyond exam scope.) For more Topic 6.5 review, see the Fiveable study guide (https://library.fiveable.me/ap-microeconomics/unit-6/inequality/study-guide/rmL71WEQFiM4gxDOnFca) and Unit 6 overview (https://library.fiveable.me/ap-microeconomics/unit-6). Practice more with questions at (https://library.fiveable.me/practice/ap-microeconomics).
I don't understand how marginal product theory explains why some people make way more money than others - can someone explain?
Marginal product theory says each factor of production (like a worker) is paid roughly the value of its marginal product—the extra output (times price) produced by one more unit of that factor. So people who add more value per hour (because of greater human capital: skills, education, experience; or because they work with complementary capital) earn more. That’s why a highly specialized surgeon or a top software engineer gets paid way more than an entry-level worker: their marginal product (and thus marginal revenue product) is much higher. Other CED sources of inequality—inheritance, discrimination, access to credit, bargaining power—shape who can build human/social capital or negotiate higher pay (EK POL-5.B.1). For AP study, know the core idea that factor payments equal marginal product (EK POL-5.B.1) and review Topic 6.5 on Fiveable (study guide: https://library.fiveable.me/ap-microeconomics/unit-6/inequality/study-guide/rmL71WEQFiM4gxDOnFca). For extra practice, try problems at (https://library.fiveable.me/practice/ap-microeconomics).
What are the main sources of income inequality in the economy?
Main sources of income and wealth inequality come from how factors of production are paid (each gets its marginal product) and from social and policy differences. Key drivers: differences in human capital (education, skills), social capital/networks, and inheritance or wealth passed across generations; discrimination in labor markets; unequal access to financial markets and credit; differences in mobility (how easy it is to move up); bargaining power (firms, unions, families); and tax structure (progressive vs. regressive taxes). These create persistent gaps you can measure with the Lorenz curve and Gini coefficient (AP asks you to define and interpret, not calculate). On the exam, link these sources to market outcomes or policy effects (e.g., how taxes or unions change income distribution). For a focused review, see the Topic 6.5 study guide (https://library.fiveable.me/ap-microeconomics/unit-6/inequality/study-guide/rmL71WEQFiM4gxDOnFca) and practice questions at (https://library.fiveable.me/practice/ap-microeconomics).
What's the difference between progressive and regressive taxes and how do they affect inequality?
Progressive taxes take a larger share of income from high earners (tax rate rises as income rises); regressive taxes take a larger share from low earners (rate falls as income rises). On inequality: progressive taxes reduce post-tax income inequality by redistributing income downward or funding transfers/programs that help low-income groups, which moves the income distribution closer to the 45° line on a Lorenz curve (lower Gini). Regressive taxes (like flat sales taxes) tend to increase after-tax inequality because they hit lower-income households harder as a share of income. AP tie-in: the CED lists tax structures as a source of inequality (EK POL-5.B.2) and you should be able to explain how tax design affects income distribution (POL-5). For a quick review, see the Topic 6.5 study guide (https://library.fiveable.me/ap-microeconomics/unit-6/inequality/study-guide/rmL71WEQFiM4gxDOnFca) and more practice at (https://library.fiveable.me/practice/ap-microeconomics).
How does human capital vs social capital contribute to income differences between people?
Human capital and social capital both drive income differences, but in different ways. Human capital is skills, education, experience—it raises a worker’s marginal product of labor, so employers pay higher wages to more productive workers. Differences in schooling, training, or experience therefore create income gaps (EK POL-5.B.1). Social capital is networks, connections, and trust that help people find better jobs, access credit, or get promotions; it affects bargaining power and opportunity, so two people with similar human capital can still earn very different incomes. Other CED factors (inheritance, discrimination, access to financial markets) interact with both. On the AP exam, link this to the idea that each factor of production receives the value of its marginal product (EK POL-5.B.1) and list human vs social capital as sources of inequality (EK POL-5.B.2). For more review, see the Topic 6.5 study guide (https://library.fiveable.me/ap-microeconomics/unit-6/inequality/study-guide/rmL71WEQFiM4gxDOnFca) and extra practice problems (https://library.fiveable.me/practice/ap-microeconomics).
Why do inheritance and discrimination cause wealth gaps between different groups?
Inheritance and discrimination drive wealth gaps by affecting who starts with assets and who can turn income into lasting wealth. Inheritance passes capital (houses, stocks, businesses) across generations, so families with wealthy parents can buy better education, access credit, and invest—boosting human and social capital and raising intergenerational mobility for them while others fall behind. Discrimination in labor and credit markets (lower wages, hiring barriers, redlining) reduces earnings and blocks access to loans or investments, so affected groups can’t accumulate or grow wealth. Over time these forces compound: lower returns, less bargaining power, and limited financial-market access concentrate wealth and widen the Lorenz/Gini gap. This aligns with EK POL-5.B.2 (inheritance, discrimination, access to financial markets, mobility). For a quick AP-aligned review, see the Topic 6.5 study guide (https://library.fiveable.me/ap-microeconomics/unit-6/inequality/study-guide/rmL71WEQFiM4gxDOnFca) and more practice problems (https://library.fiveable.me/practice/ap-microeconomics).
How does access to financial markets create inequality and what does that even mean?
Access to financial markets means who can borrow, save, invest, and get insurance. When some people can get cheap credit and invest in education, businesses, or housing while others can’t, those with access earn higher returns on capital (marginal product of capital) and build wealth faster. That raises both income and wealth inequality over time—wealth compounds and is often passed on (inheritance, intergenerational mobility). Credit constraints also keep people from smoothing consumption or funding human capital, so differences in access become a persistent source of inequality (EK POL-5.B.1 & EK POL-5.B.2). On the AP exam, you should link this to income/wealth measures (Lorenz/Gini) and to sources like human capital, inheritance, and access to financial markets (POL-5, POL-5.B). For a concise review, see the Topic 6.5 study guide (https://library.fiveable.me/ap-microeconomics/unit-6/inequality/study-guide/rmL71WEQFiM4gxDOnFca). For broader unit review and lots of practice questions, check the unit page (https://library.fiveable.me/ap-microeconomics/unit-6) and practice bank (https://library.fiveable.me/practice/ap-microeconomics).
I'm confused about how bargaining power in firms and unions affects income distribution - help?
Bargaining power changes how the return to a factor (like labor) is split, which affects income distribution (POL-5.B; EK POL-5.B.1–2). If workers (individually or via unions) have more bargaining power, they can push wages above the competitive market wage—especially for jobs with high marginal product of labor—raising workers’ share of income and reducing inequality within that firm/sector. Conversely, strong employer bargaining power (monopsony, weak unions) lets firms pay lower wages, shifting income toward owners/capital and increasing inequality. Bargaining also interacts with human capital and discrimination: groups with less bargaining power earn less even if marginal product is similar (contributes to observed income gaps). For AP review, link this idea to “factors receive value of marginal product” and to policy/redistribution topics in Topic 6 (see the Topic 6.5 study guide) (https://library.fiveable.me/ap-microeconomics/unit-6/inequality/study-guide/rmL71WEQFiM4gxDOnFca). For more practice, check Unit 6 overview (https://library.fiveable.me/ap-microeconomics/unit-6) and 1000+ problems (https://library.fiveable.me/practice/ap-microeconomics).
What are some real world examples of how the Gini coefficient differs between countries like the US vs Nordic countries?
The Gini coefficient summarizes a country’s income inequality (from the Lorenz curve). Real-world: the U.S. typically has a much higher income Gini (commonly reported around ~0.4–0.5) than Nordic countries (often ~0.25–0.3). Practically that means U.S. income is noticeably more concentrated at the top—larger gaps between rich and poor—while Nordic countries show a more even distribution thanks to progressive taxes, large welfare transfers, universal healthcare/education, stronger unions, and policies that boost human capital and mobility. Those policy differences (tax structure, transfers, labor-market institutions, inheritance rules) are direct sources of the Gini gap per POL-5.B. For AP review, you should be able to define these measures and explain sources of inequality (POL-5.A/B); see the Topic 6.5 study guide for a concise rundown (https://library.fiveable.me/ap-microeconomics/unit-6/inequality/study-guide/rmL71WEQFiM4gxDOnFca). For more practice, check the unit practice problems (https://library.fiveable.me/practice/ap-microeconomics).
How do factors like education, race, and gender contribute to income inequality according to economic theory?
Economic theory links education, race, and gender to income inequality mainly through differences in factors of production and market frictions. More education raises a worker’s human capital and thus their marginal product of labor, so better-educated workers earn higher wages. Race and gender can affect wages through discrimination (employers paying different wages for the same marginal product), unequal access to credit or training (which limits human capital accumulation), inheritance and social capital, and differences in bargaining power (e.g., union membership or job mobility). These forces change income and wealth distributions measured by tools like the Lorenz curve and the Gini coefficient (0 = perfect equality, 1 = max inequality). Policy levers—progressive taxes, anti-discrimination law, education subsidies, or improved access to credit—can reduce gaps. For more AP-aligned review, check the Topic 6.5 study guide (https://library.fiveable.me/ap-microeconomics/unit-6/inequality/study-guide/rmL71WEQFiM4gxDOnFca), the Unit 6 overview (https://library.fiveable.me/ap-microeconomics/unit-6), and extra practice (https://library.fiveable.me/practice/ap-microeconomics).
Can someone explain how tax policy can either increase or decrease inequality in simple terms?
Taxes change people’s after-tax income, so they can make income distribution more or less equal. A progressive tax charges higher rates on higher incomes (e.g., 10% on low incomes, 30% on high incomes) and therefore reduces post-tax inequality—top earners keep a smaller share, so the income distribution becomes more equal (you’d see a Lorenz curve move closer to the 45° line and a lower Gini). A regressive or flat tax (everyone pays the same rate) tends to keep or increase inequality because lower-income households pay a larger share of their income for necessities after taxes. Governments can also use tax credits, transfers, or refundable tax benefits (targeted to low-income households) to decrease inequality and lower the poverty rate. Conversely, tax cuts concentrated at the top or eliminating progressive elements usually increase inequality. For AP exam review, focus on “progressive vs. regressive tax structures,” effects on after-tax income and poverty, and linking these to measures of inequality (POL-5.A/B). More on Topic 6.5 is in the Fiveable study guide (https://library.fiveable.me/ap-microeconomics/unit-6/inequality/study-guide/rmL71WEQFiM4gxDOnFca) and practice problems (https://library.fiveable.me/practice/ap-microeconomics).
What's the connection between factor payments and income inequality that I need to know for the AP exam?
Factor payments are a key reason income is unequal. On the AP CED you need to know that each factor of production (labor, capital) earns the value of its marginal product—so differences in marginal product (driven by human capital, experience, technology, or returns to capital) lead to different incomes (EK POL-5.B.1). That’s why workers with more education or specialized skills earn more, and owners of capital can concentrate wealth. Other sources—inheritance, discrimination, access to credit, bargaining power, and tax structures (progressive vs. regressive)—amplify those gaps (EK POL-5.B.2). You should also recognize the Lorenz curve and Gini coefficient as ways to represent inequality, though you won’t be asked to draw or calculate them on the exam (EK POL-5.A.2). For a quick review, check the Topic 6.5 study guide (https://library.fiveable.me/ap-microeconomics/unit-6/inequality/study-guide/rmL71WEQFiM4gxDOnFca) and Unit 6 overview (https://library.fiveable.me/ap-microeconomics/unit-6); practice questions are at (https://library.fiveable.me/practice/ap-microeconomics).
Why do economists say market outcomes naturally lead to income inequality?
Economists say market outcomes naturally create income inequality because markets pay each factor of production its marginal product—so people who supply more valuable skills or scarce capital earn more. Differences in human capital (education/skills), social capital, inheritance, access to credit, discrimination, mobility, and bargaining power cause some people’s marginal products to be much higher than others (EK POL-5.B.1 & EK POL-5.B.2). Taxes and transfers can reduce inequality, but left to pure market payments you still get uneven income and wealth distributions, which we summarize with the Lorenz curve and Gini coefficient (EK POL-5.A.2). In short: markets allocate rewards based on productivity and ownership, not on equality—so unequal abilities, opportunities, and initial endowments lead to unequal outcomes. For a short topic review, see the AP Topic 6.5 study guide (https://library.fiveable.me/ap-microeconomics/unit-6/inequality/study-guide/rmL71WEQFiM4gxDOnFca); for broader unit review and practice, check the unit page (https://library.fiveable.me/ap-microeconomics/unit-6) and practice problems (https://library.fiveable.me/practice/ap-microeconomics).