Grow Grow Grow!
We always talk about economic growth. On the news, in books, it's everywhere! It's one of the top priorities when it comes to voting. So what exactly constitutes growth?

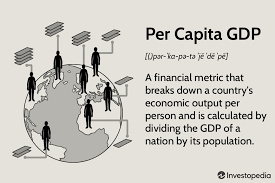
GDP per capita
Remember GDP? Growth is measured through real GDP per capita over time. Per capita is just real GDP divided by the number of people within that country. If this GDP per capita increases over time, then it's proof that economy grew.
GDP per capita = real GDP / population
Review
So far, we've learned about what economic growth can constitute. Do you remember??
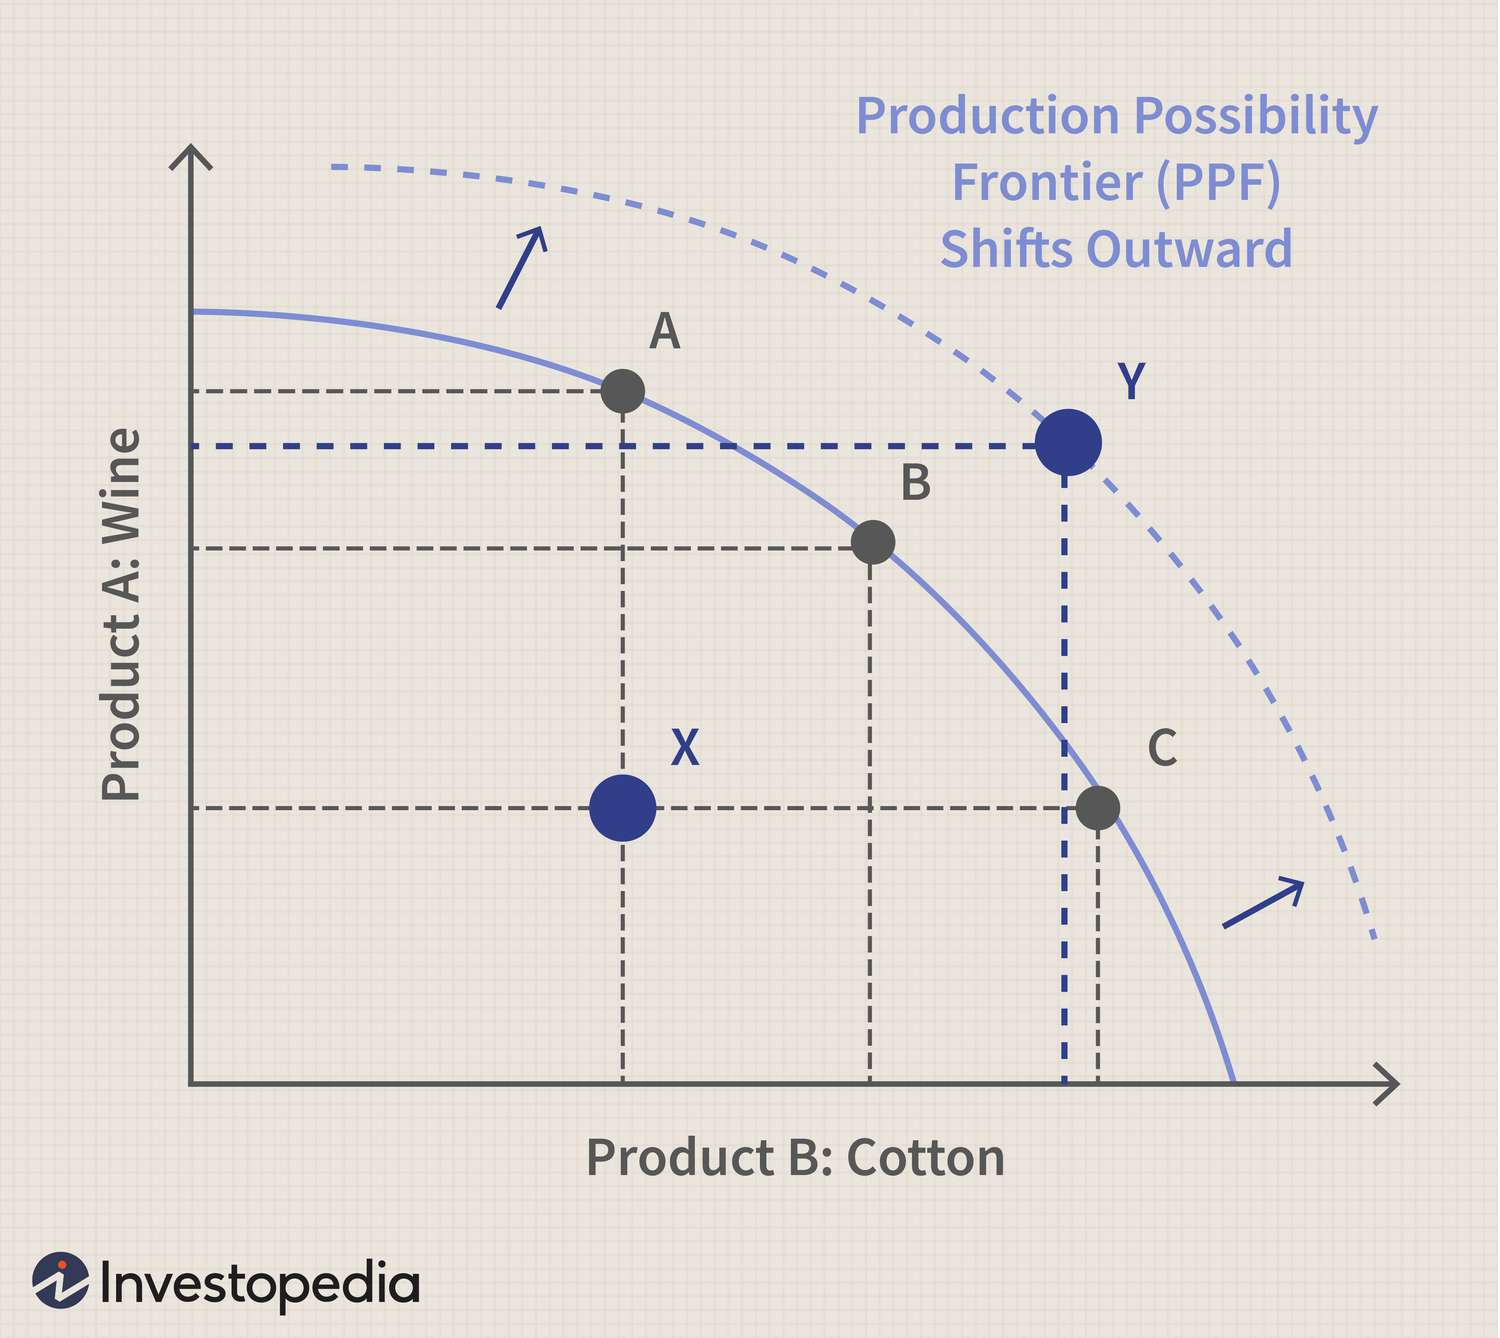
Economic growth is seen by a rightward shift of the LRAS (Long-run aggregate supply) curve. This corresponds to a rightward shift of the Production Possibilities Frontier. It's like instead of operating at A, B, and C, the economy shifts its potential possibilities to Y, making it more efficient and productive to produce more of each product. Growth refers to an economy's ability to produce more than before, so expanding the production possibility frontier would prove to be an increase in ability to produce.
The long-run aggregate supply (LRAS) refers to the output that an economy can produce when using all its factors of production (human capital, physical capital, land, labor, entrepreneurship), and hence when operating at full employment. In the graph below, LRAS is shifted to LRAS1, which is a higher real GDP (or output). That's good news, because that's growth 🌱.

Aggregate Production Function
The aggregate production function is a function that shows the relationship between production and capital. It's another way to show long-run economic growth.
The aggregate production function shows that aggregate employment and aggregate output are directly related. Why? It's because more workers will produce more if all other factors are held constant. For example, if labor is insufficient, productivity will decline. The function basically calculates what inputs efficiently produce outputs.
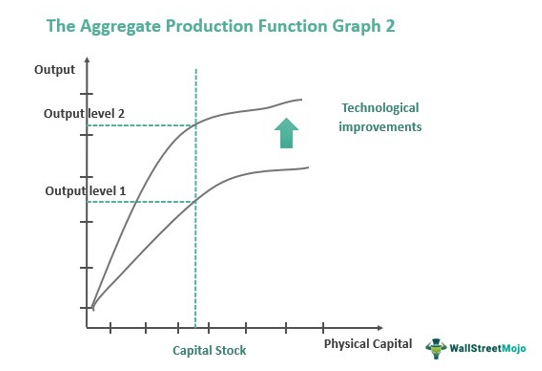
When the aggregate production function moves up, you know that it's an increase in productivity and economic growth!
Productivity
Productivity, according to the aggregate production function model, is determined by the amount of technology and physical and human capital per worker. It's the measuring of how much stuff can be produced by one worker during a given time. What does that mean? It means how much each worker has the skills and education for the work (human capital), how much of the physical environment is fit for working (physical capital) and how much technology there is to make tedious tasks faster and easier with the help of technology.
Factors
- Technology
- Advancement of technology could speed up production and influence productivity.
- For example, advances in agricultural technology could make farming more efficient and enable farmers grow more food. This would increase productivity and lead to economic growth.
- Even the invention of the wheel, Internet, and phones have changed the economy forever. Have you ever heard of the cotton gin? Invented by Eli Whitney, it increased the productivity of cotton exponentially. As a result, cotton became a very lucrative crop. Problem was, because many people went into the cotton industry, the demand for slaves soared in the South. Long story short, the invention of the cotton gin basically set the economic stage for the Civil War! A short tie to APUSH 😊
- Anywho, because technology is important, the government has created policies to fund research and provide incentives to invent new things. The government also funds professors and labs throughout our country in order to advance technology.
- Amount of physical capital
- Physical capital includes tangible, man-made objects that a company buys and uses to produce goods. The machinery, buildings, vehicles, and computers that a company owns are all considered part of its physical capital.
- For example, if a company invests in a new warehouse, then they can hire more workers, who will produce more goods. Thus, an increase in physical capital will lead to an increase in productivity.
- Supply-side policies are related to this because increased investment is also a type of increase in physical capital. More to come about supply-side stuff in the next section!
- Amount of human capital
- Human capital includes resources that people can provide such as education, experience, or unique skills. If the workers are more skilled and have obtained higher education then productivity will increase.
- If a hotel workers knew how to speak different languages in order to help its guests, that would be a plus right?
- If an accountant earned a stockbroker's license, that would increase the accountant's productivity.
- If the hospital is vaccinated against a disease, they'll be more productive even during disease outbreaks.
- Because human capital is super valuable in productivity, many nations create policies to increase human capital. These include more subsidies for public education, lower prices of interest of student loans and promote research through governmental agencies.
- Remember, even you studying this right now is increasing human capital because it might help sometime in your life and increase your productivity. So keep up the good work and you got this!! 🦾
- Natural resources
- Natural resources are crucial to success in an economy. If a nation lacks minerals, fertile soil, timber or is landlocked, the economy will struggle to grow. Though some countries have found other ways to grow, natural resources are definitely great if you have them.
- An example is Canada. Canada is blessed with a bunch of natural resources, so even with a smaller population than the US, it has been able to grow its economy pretty quickly.
- Nonrenewable resources, as you probably know, are resources that cannot be replenished. Meaning, once you use them, they're gone and we'll only keep running out of them. Examples include oil and coal.
- Renewable resources, on the other hand, are resources that can be replenished. These include things like timer and salmon.
- Environmental policies strive to protect these natural resources, but it can decrease productivity a little since these resources are used through regulations (used at smaller amounts) in the short run.
- However, in the long run, environmental policies increase productivity 😉
Common Factor
What do these four factors have in common? It's all about money 💵. All these factors require some sort of investment from saving. Firms invest in physical capital and individuals invest in human capital. Physical capital (obviously) needs money because you have to build things, and higher education costs money for human capital. This is why saving is as important as investing. If you haven't saved enough money, you'll likely have to take out a loan in college. If you have money, it'll be easier for you to invest in human capital.
Quick MCQ
Which of the following would likely slow a nation's long-term economic growth?
A. Guaranteed low-interest loans for college students
B. Removal of a tax on income earned on saving
C. Removal of the investment tax credit
D. More research grants given to medical schools
E. Conservation policies to manage the renewable harvest of timber
✨
✨
✨
✨
✨
✨
✨
✨
Answer: C. Removal of the investment tax credit
If you don't know what tax credits are, it's ok! You can solve this problem through process of elimination without even knowing what tax credits are. A, B, D, and E are all policies that increase productivity. A and B increases productivity in the human capital realm, D for technology and E for natural resources. That only leaves you with C, which is the correct answer.
If you're curious, tax credits provide incentives to those who invest in assets. If these tax credits are removed, investment would slow down, meaning no money 💰 and less productivity.
Frequently Asked Questions
What is economic growth and how do you actually measure it?
Economic growth = a rise in real GDP per person over time—it’s how the economy “gets bigger” in ways that raise living standards (CED: EK MEA-2.B.1). You measure it by the growth rate of real GDP per capita: compute real GDP per capita for two periods, then % change. Example: real GDP per capita goes from $30,000 to $31,500 → (31,500 − 30,000)/30,000 = 0.05 = 5% growth. Why growth happens: think aggregate production function—output per worker rises with more physical capital (capital deepening), more human capital, and better technology/total factor productivity (CED: EK MEA-2.B.2–2.B.5). Diminishing returns mean you need tech progress or more human capital to sustain growth long run. On the exam you may be asked to calculate growth or show PPC/LRAS shifts (PPC outward ↔ LRAS right)—review the Topic 5.6 study guide (https://library.fiveable.me/ap-macroeconomics/unit-5/economic-growth/study-guide/JU2OeMV9C6KoasNunMEX) and practice problems (https://library.fiveable.me/practice/ap-macroeconomics).
How do I calculate per capita GDP from the data they give us?
Per capita GDP = real GDP divided by population. Steps if they give you nominal GDP and a GDP deflator: 1. Convert nominal GDP to real GDP: Real GDP = Nominal GDP ÷ (GDP deflator / 100). 2. Divide by population: Real GDP per capita = Real GDP ÷ Population. 3. To get the economic growth rate in per capita terms: [(Real GDP per capita this year − last year) ÷ last year] × 100%. Example from the CED table: 2012 nominal GDP = $225,000, deflator = 125, population = 120. Real GDP = 225,000 ÷ 1.25 = $180,000. Real GDP per capita = 180,000 ÷ 120 = $1,500. If you need growth, compute percent change in that per-capita number. This calculation is exactly what EK MEA-2.B.1 expects on the AP exam (use real GDP per capita as the growth measure). For more Topic 5.6 review, see the Fiveable study guide (https://library.fiveable.me/ap-macroeconomics/unit-5/economic-growth/study-guide/JU2OeMV9C6KoasNunMEX) and practice problems (https://library.fiveable.me/practice/ap-macroeconomics).
What's the difference between real GDP growth and per capita GDP growth?
Real GDP growth = the percent change in inflation-adjusted total output (real GDP) over time. Real GDP per capita growth = the percent change in real GDP divided by population (real GDP per person). The AP CED emphasises real GDP per capita as the key measure of economic growth because it better captures changes in average living standards (EK MEA-2.B.1). How to calculate: real GDP growth = (Real GDPt − Real GDPt−1) / Real GDPt−1 × 100%. Per capita growth uses real GDP per person: (Real GDP/Population)t − (Real GDP/Population)t−1 divided by the previous period’s real GDP per capita × 100%. Why it matters: total output can rise simply because population rises; only per capita growth shows gains in average welfare driven by productivity, capital deepening, and technology (see aggregate production function, EK MEA-2.B.2–B.5). For AP review, check the Topic 5.6 study guide (https://library.fiveable.me/ap-macroeconomics/unit-5/economic-growth/study-guide/JU2OeMV9C6KoasNunMEX) and hit practice problems (https://library.fiveable.me/practice/ap-macroeconomics).
I don't understand the aggregate production function - can someone explain it simply?
Think of the aggregate production function as a simple recipe that tells how the economy turns inputs into output. It’s usually written as Y = A · F(K, L)—meaning real GDP (Y) depends on technology/total factor productivity (A) and a function of physical capital (K) and labor (L). For AP purposes focus on these CED ideas: output per worker (Y/L) rises when workers have more physical capital (machines) or human capital (skills), and when A (technology) improves (EK MEA-2.B.2–4). Two quick consequences to remember: 1) Diminishing returns—each extra unit of capital raises output less than the previous one, and 2) Capital deepening (more K per worker) raises labor productivity and real GDP per capita. You’ll be asked to explain and graph these relationships on the exam (see Topic 5.6). For a short study guide and practice problems on growth and the production function, check the Fiveable study guide (https://library.fiveable.me/ap-macroeconomics/unit-5/economic-growth/study-guide/JU2OeMV9C6KoasNunMEX) and the practice set (https://library.fiveable.me/practice/ap-macroeconomics).
How does the PPC relate to the LRAS curve and why do they both shift right?
The PPC and the LRAS both show an economy’s productive capacity—just in different models. The PPC (production possibilities curve) shows maximum combinations of two goods at full employment; LRAS (long-run aggregate supply) is a vertical line at potential (full-employment) real GDP. An outward shift of the PPC is analogous to a rightward shift of LRAS (CED EK MOD-1.C.1): both mean the economy can produce more at full employment. They shift right for the same reasons: higher productivity from better technology, more physical capital per worker (capital deepening), improved human capital, greater labor supply, or improvements in total factor productivity (CED EK MEA-2.B.4/2.B.5). On the AP exam you might be asked to draw the PPC and AD-SRAS-LRAS graphs and show these shifts (Topic 5.6; see EK MOD-1.C). For extra review, check the Topic 5.6 study guide (https://library.fiveable.me/ap-macroeconomics/unit-5/economic-growth/study-guide/JU2OeMV9C6KoasNunMEX) and practice questions (https://library.fiveable.me/practice/ap-macroeconomics).
What exactly is labor productivity and how is it different from just total output?
Labor productivity = output per employed worker (often measured as real GDP divided by number of workers). It’s a measure of how much each worker produces on average (EK MEA-2.B.3). Total output (real GDP) is the economy’s aggregate production—that’s the sum of everything produced, not adjusted for how many workers made it. Why the distinction matters: two countries can have the same total output but very different productivity if one has many more workers. Productivity captures efficiency and is driven by technology, physical capital per worker (capital deepening), and human capital (EK MEA-2.B.4–5). On the AP exam you’ll often use real GDP per capita or output per worker to measure long-run growth (EK MEA-2.B.1) and explain shifts in the aggregate production function. Want practice problems and an AP-aligned study guide on this topic? Check the Topic 5.6 study guide (https://library.fiveable.me/ap-macroeconomics/unit-5/economic-growth/study-guide/JU2OeMV9C6KoasNunMEX) and more practice sets (https://library.fiveable.me/practice/ap-macroeconomics).
I'm confused about physical capital vs human capital - what's the difference?
Physical capital = the stock of man-made tools, machines, buildings, and infrastructure workers use (factories, computers, roads). Human capital = workers’ skills, education, health, and training—anything that raises a worker’s ability to produce. In the aggregate production function, output per worker rises when either physical or human capital per worker increases; both raise labor productivity (EK MEA-2.B.3–B.5). Key differences: physical capital is a tangible input you can invest in directly (investment increases the capital stock); human capital is embodied in people and improves with education, on-the-job training, and health. Both face diminishing returns alone, so long-run growth also needs technological progress or total factor productivity. For AP free-response, be ready to explain how increases in each shift the PPC and LRAS outward (Unit 5) and use per-worker measures. Review this topic’s study guide (https://library.fiveable.me/ap-macroeconomics/unit-5/economic-growth/study-guide/JU2OeMV9C6KoasNunMEX) and try practice problems (https://library.fiveable.me/practice/ap-macroeconomics).
How do I know when economic growth will shift the LRAS curve right?
LRAS shifts right whenever the economy’s potential (full-employment) output increases—not just when actual GDP rises. Practically, that happens when determinants of productivity improve: higher total factor productivity/technology, more physical capital per worker (investment, capital deepening), more human capital (education, training), a larger/better-quality labor force, or better institutions that raise output per worker. On the PPC this is an outward shift; on the AD/AS graph LRAS moves right. For the AP exam, be ready to show and explain a rightward LRAS shift on a free-response graph and to link it to increases in real GDP per capita (EK MEA-2.B.* and MOD-1.C.*). Review examples and practice problems in the Topic 5.6 study guide (https://library.fiveable.me/ap-macroeconomics/unit-5/economic-growth/study-guide/JU2OeMV9C6KoasNunMEX) and more unit practice (https://library.fiveable.me/ap-macroeconomics/unit-5).
Why does hiring more workers increase output but productivity might stay the same?
Hiring more workers raises total output because firms can produce more goods—more hands mean more tasks done, so aggregate output (real GDP) goes up. But productivity (output per worker) depends on output divided by number of workers. If you add workers but don’t change technology or the amount of capital (machines, tools, training) per worker, each worker might produce about the same amount, so output/person stays unchanged. That idea comes from the aggregate production function: output rises with more labor, but productivity depends on technology and physical/human capital per worker (and faces diminishing returns). To raise output per worker you need capital deepening or better technology, not just more workers. For AP review, this connects directly to EK MEA-2.B.2–2.B.5 and the production-function idea—see the Topic 5.6 study guide (https://library.fiveable.me/ap-macroeconomics/unit-5/economic-growth/study-guide/JU2OeMV9C6KoasNunMEX) and practice problems (https://library.fiveable.me/practice/ap-macroeconomics).
What happens to the PPC when a country invests more in education and technology?
Investing more in education and technology raises human capital and total factor productivity, so the economy can produce more output with the same inputs. On a PPC that means the curve shifts outward—every combination of goods becomes more attainable (this is economic growth measured as higher real GDP per capita per EK MEA-2.B.1 and EK MEA-2.B.4). That outward shift of the PPC is analogous to a rightward shift of the LRAS curve (EK MOD-1.C.1), meaning full-employment output rises in the long run. In AP free-response questions you’d show this by drawing the PPC (or LRAS) and shifting it outward to illustrate higher potential output. For a quick review of these ideas, see the Topic 5.6 study guide (https://library.fiveable.me/ap-macroeconomics/unit-5/economic-growth/study-guide/JU2OeMV9C6KoasNunMEX). For more practice drawing and interpreting shifts, check Unit 5 (https://library.fiveable.me/ap-macroeconomics/unit-5) and the AP practice problems (https://library.fiveable.me/practice/ap-macroeconomics).
How do I calculate the growth rate in real GDP per capita from a table?
You do three things: convert to real GDP if needed, compute per capita, then find the percent change. Steps (with formulas): 1. If the table gives nominal GDP and a GDP deflator, get real GDP: Real GDP = (Nominal GDP / GDP deflator) × 100. 2. Compute real GDP per capita: Real GDP per capita = Real GDP / Population. 3. Compute the growth rate between Year 1 and Year 2: Growth rate (%) = [(Real GDP per capita₂ − Real GDP per capita₁) / Real GDP per capita₁] × 100. Quick example: Year 1 real GDP = $100,000, population = 100 → per capita = $1,000. Year 2 real GDP = $120,000, population = 110 → per capita = $1,091. Growth = [($1,091 − $1,000)/$1,000]×100 = 9.1%. On AP free-response you must show these steps and work. For more practice and the Topic 5.6 study guide see (https://library.fiveable.me/ap-macroeconomics/unit-5/economic-growth/study-guide/JU2OeMV9C6KoasNunMEX) and more problems at (https://library.fiveable.me/practice/ap-macroeconomics).
I don't get why output per worker matters more than just total output sometimes?
Think of total output (real GDP) like the size of the pie and output per worker (labor productivity) like how big each person’s slice is. Total output can grow just because you have more workers (population growth), but that doesn’t raise the average person’s living standard. AP measures economic growth as real GDP per capita (EK MEA-2.B.1) because per-worker (or per-capita) output shows productivity—what each worker produces on average (EK MEA-2.B.3). Productivity depends on technology and capital per worker (physical and human capital) via the aggregate production function (EK MEA-2.B.2, .4, .5). So policymakers care about output per worker: it drives wages, living standards, and sustainable long-run growth (capital deepening and tech progress overcome diminishing returns). For more practice and graphs (AP often asks you to explain/draw these), check the Topic 5.6 study guide (https://library.fiveable.me/ap-macroeconomics/unit-5/economic-growth/study-guide/JU2OeMV9C6KoasNunMEX) and the Unit 5 overview (https://library.fiveable.me/ap-macroeconomics/unit-5). For lots of problems, see practice (https://library.fiveable.me/practice/ap-macroeconomics).
Can someone explain how technology affects the aggregate production function?
Think of the aggregate production function as Y = A · F(K, L) where A = total factor productivity (technology). A positive technological improvement raises A, so the whole production function shifts up: for any given amounts of physical capital per worker (K/L) and human capital, output per worker (Y/L) is higher. That means higher labor productivity, faster real GDP per capita growth, and an outward shift of the PPC and a rightward shift of LRAS. Technology also helps overcome diminishing returns to capital: while adding more K has smaller and smaller gains, a higher A gives bigger gains across the board and supports long-run growth without just piling on capital. On the AP exam you might show this as an upward shift in the Y/L vs K/L graph or note that EK MEA-2.B.4 links productivity to technology and capital per worker. For more review, see the Topic 5.6 study guide (https://library.fiveable.me/ap-macroeconomics/unit-5/economic-growth/study-guide/JU2OeMV9C6KoasNunMEX) and extra practice problems (https://library.fiveable.me/practice/ap-macroeconomics).
What's the connection between investment in capital and long-run economic growth?
Investment in capital (physical and human) raises output per worker by increasing labor productivity—that’s the core link to long-run growth. On the aggregate production function, more capital per worker (capital deepening) shifts output per worker up, moving the economy’s PPC outward and shifting LRAS right (CED EK MEA-2.B.2–5, MOD-1.C.1). But because of diminishing returns, extra capital alone gives smaller and smaller increases in growth over time; sustained long-run growth requires technological progress (total factor productivity) or faster human-capital accumulation (Solow insight). For the AP exam, you should be able to show this on a production-function or PPC/LRAS graph and explain real GDP per capita growth as the measure of growth (EK MEA-2.B.1). For more review and practice problems, see the Topic 5.6 study guide (https://library.fiveable.me/ap-macroeconomics/unit-5/economic-growth/study-guide/JU2OeMV9C6KoasNunMEX), Unit 5 overview (https://library.fiveable.me/ap-macroeconomics/unit-5), and practice set (https://library.fiveable.me/practice/ap-macroeconomics).
Why do both the PPC and LRAS shift outward when there's economic growth?
Both the PPC and the LRAS show an economy’s full-employment capacity, so when productive capacity rises they both shift outward/right. On the PPC, outward shift means the economy can produce more of both goods—because of more physical capital, higher human capital, better technology, or more workers. On the AD/AS graph, LRAS is vertical at potential (full-employment) output; the same increases in capital, labor, or total factor productivity raise that potential output, so LRAS shifts right. This is exactly what the aggregate production function and CED EK MEA-2.B describe: productivity (technology, capital per worker, human capital) raises output per worker, increasing real GDP per capita. For practice drawing and explaining these shifts (an AP free-response skill), see the Topic 5.6 study guide (https://library.fiveable.me/ap-macroeconomics/unit-5/economic-growth/study-guide/JU2OeMV9C6KoasNunMEX) and Unit 5 overview (https://library.fiveable.me/ap-macroeconomics/unit-5). For extra practice, check the 1000+ problems (https://library.fiveable.me/practice/ap-macroeconomics).