The Demand For Money
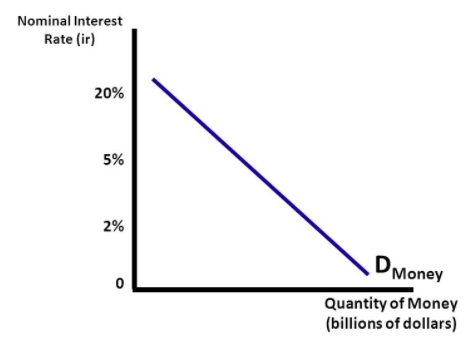
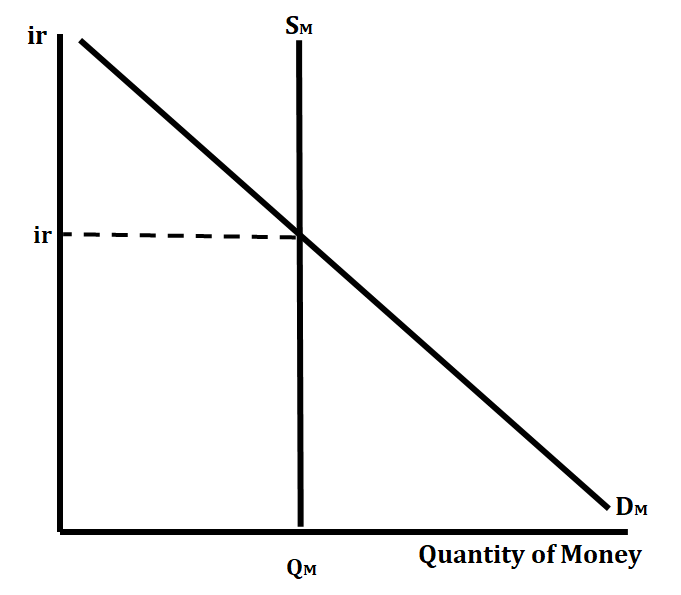
There is an inverse relationship between nominal interest rates and the quantity of money demanded.
- Nominal interest rate = real interest rate + expected inflation rate.
This inverse relationship is caused by a couple of reasons:
- People demand a certain amount of money or liquid asset. If a person chooses to hold $100 in the form of money, he or she is giving up the opportunity to hold $100 of bonds, which would pay a certain nominal interest rate. This nominal interest rate provides some additional purchasing power at the end of the loan period, as well as, compensation for inflation.
- Explanation: The opportunity cost of holding wealth in the form of money instead of in the form of other assets is the nominal interest rate. If interest rates are low, people demand more money because the opportunity cost is lower. If interest rates are high, people demand less money because the opportunity cost is higher.
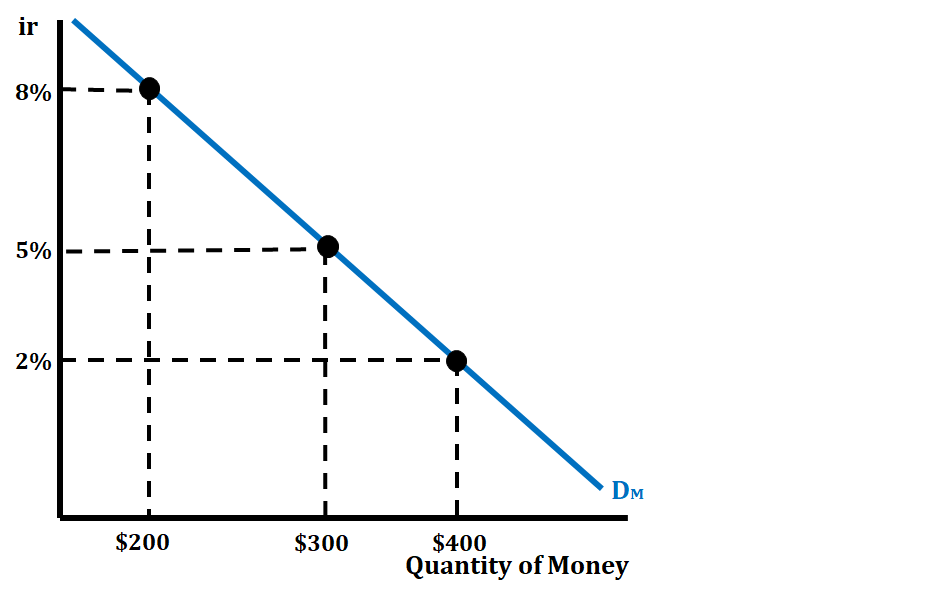
In the graph above, we are able to see the inverse relationship between the nominal interest rate and the quantity of money. As the nominal interest rate drops from 8% to 5%, we see the quantity of money increase from $200 to $300. The opposite is also true. If the nominal interest rate increases from 2% to 8%, we see the quantity of money decrease from $400 to $200.

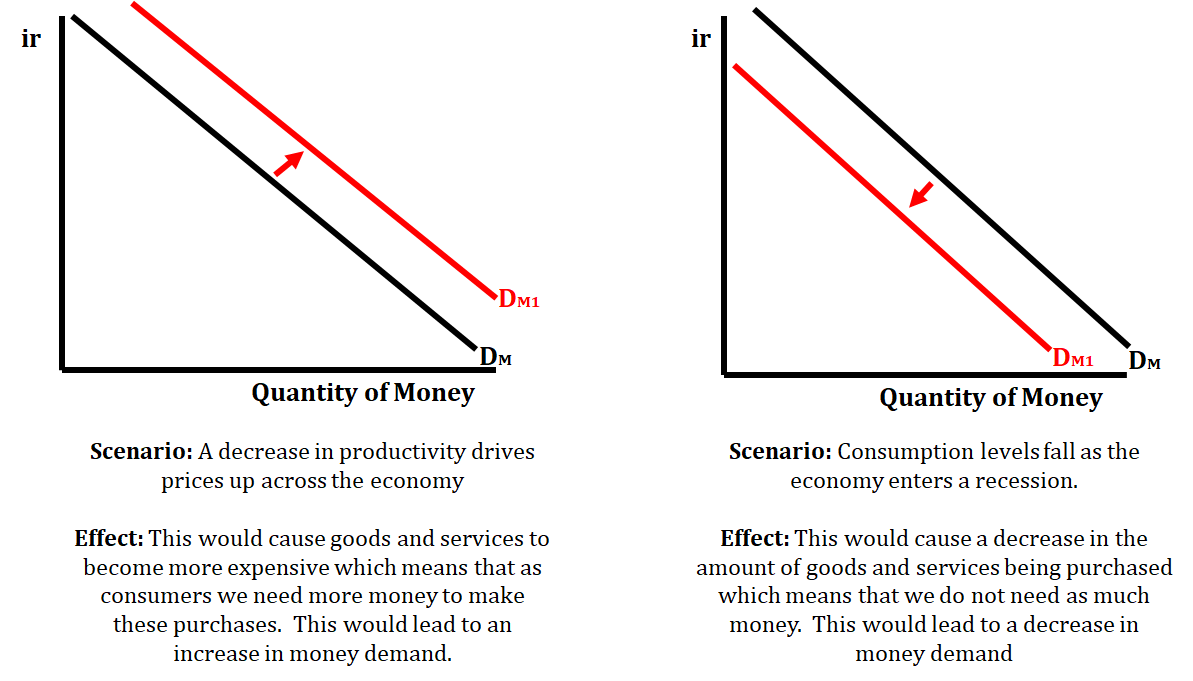
Shifters of the Demand for Money Curve
- Price Level
- Real GDP
- Transaction Costs Let's look at some examples:
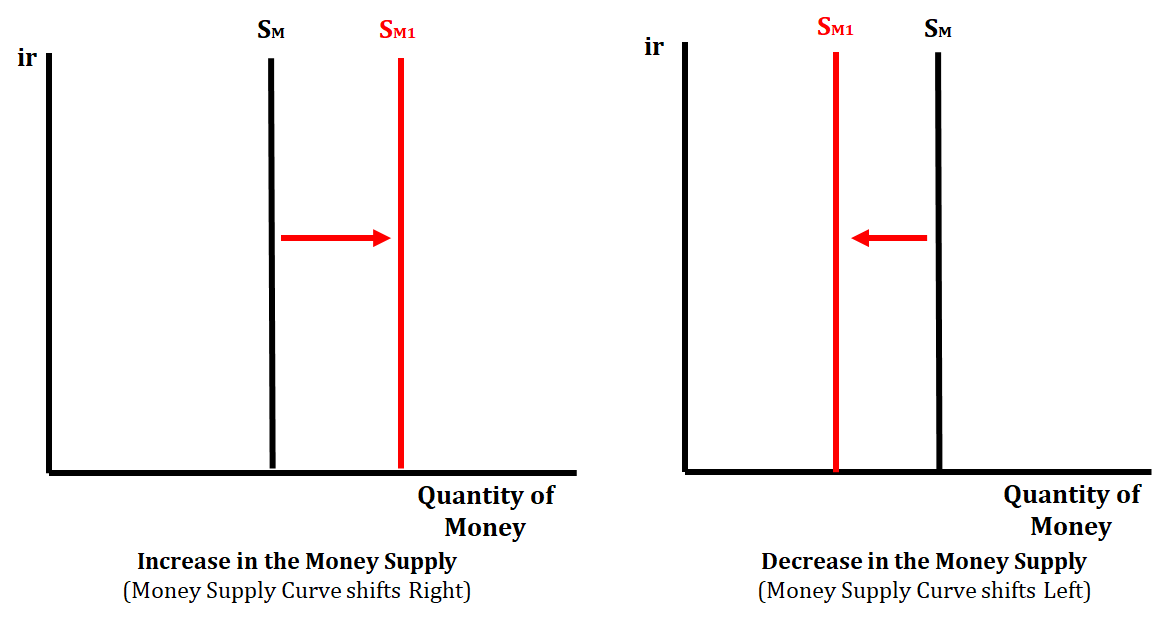
The Supply of Money
The monetary base of a nation is determined by the country’s central bank (FED). This means that the money supply is independent of the nominal interest rate. The supply of money will remain constant regardless of the nominal interest rate. The only way the money supply will change is as a result of monetary policy.
There are three tools that the FED uses to influence the money supply. These include the reserve requirement, the discount rate, open market operations (the buying and selling of bonds), and the federal funds rate.
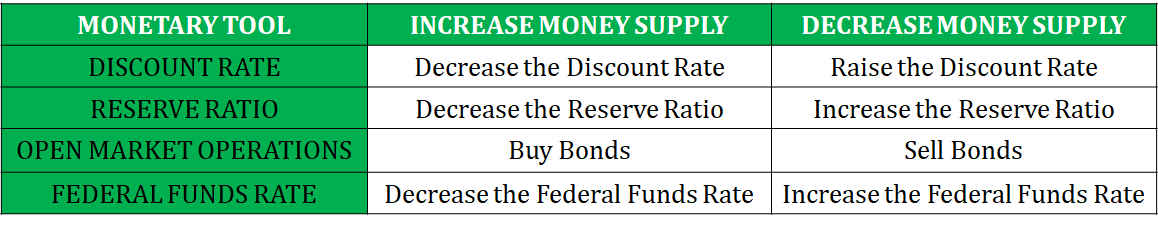
When the FED uses these tools of monetary policy, they are able to either increase or decrease the money supply. The goal when the FED is using these tools is to either increase or decrease the nominal interest rate, which will cause the economy to expand or contract. We will look at this more closely when we review the money market equilibrium in the next section.
Money Market Equilibrium
Money market equilibrium is achieved when the interest rate at which the quantity of money demanded equals the quantity of money supplied. The nominal interest rate is the interest rate on the vertical axis and the quantity of money is on the horizontal axis.
Remember that the shifters of money demand include a change in the price level, a change in real GDP output, and a change in the transaction costs of spending money. The only shifter of the supply of money is the Federal Reserve.
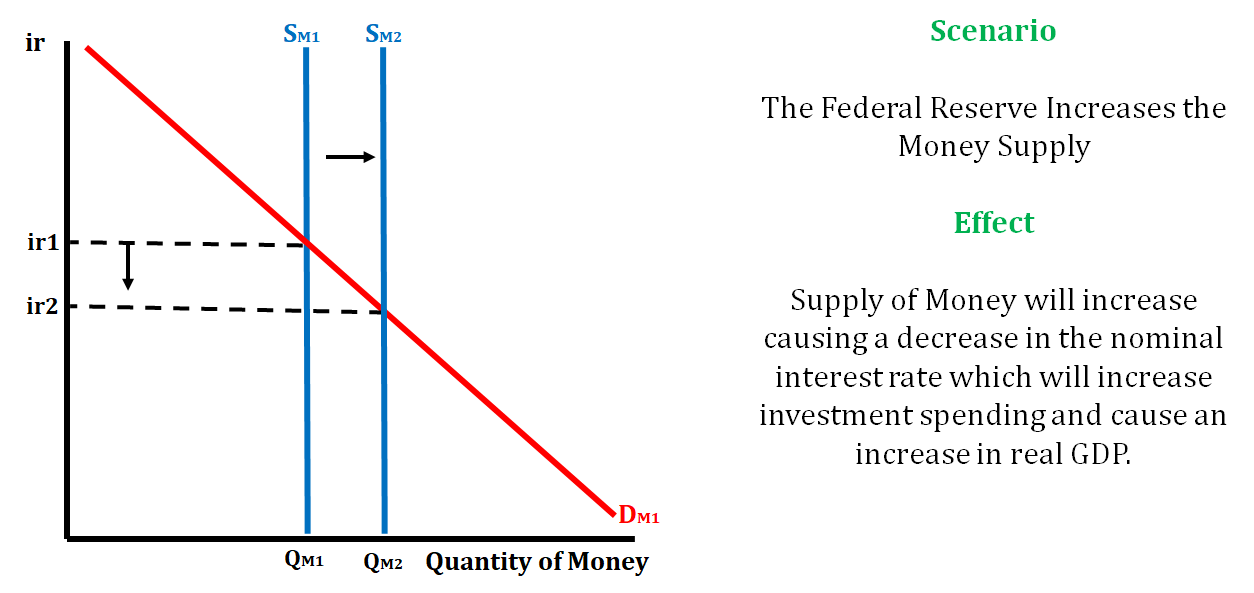
Let's look at the various ways that the money market equilibrium change through four different examples.
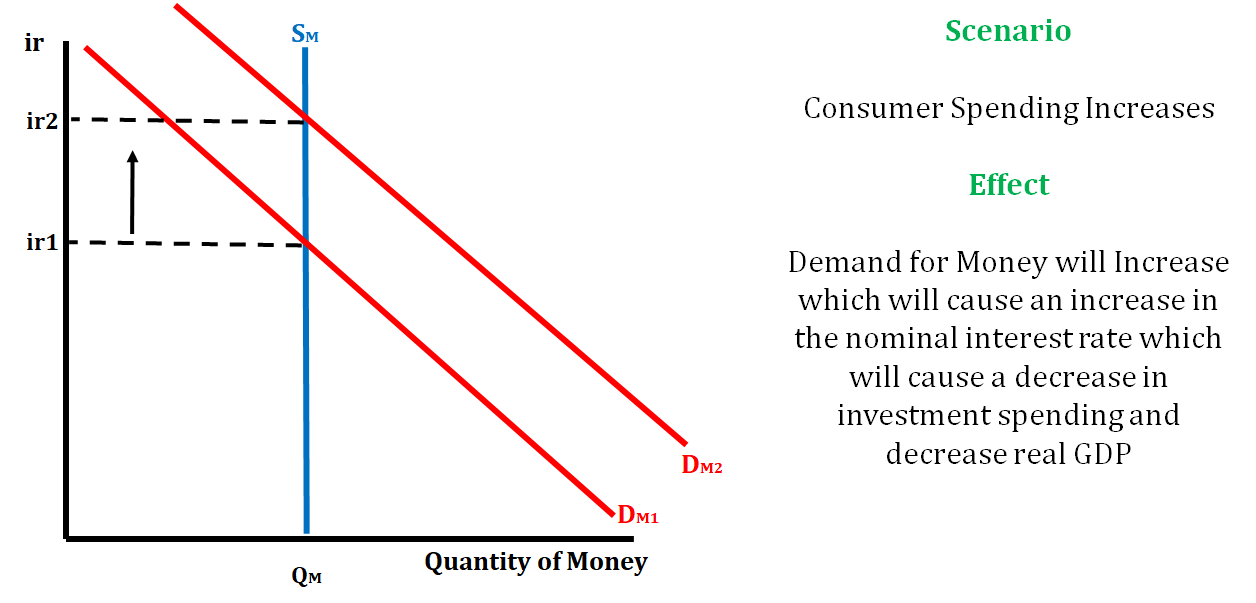
Example 1:
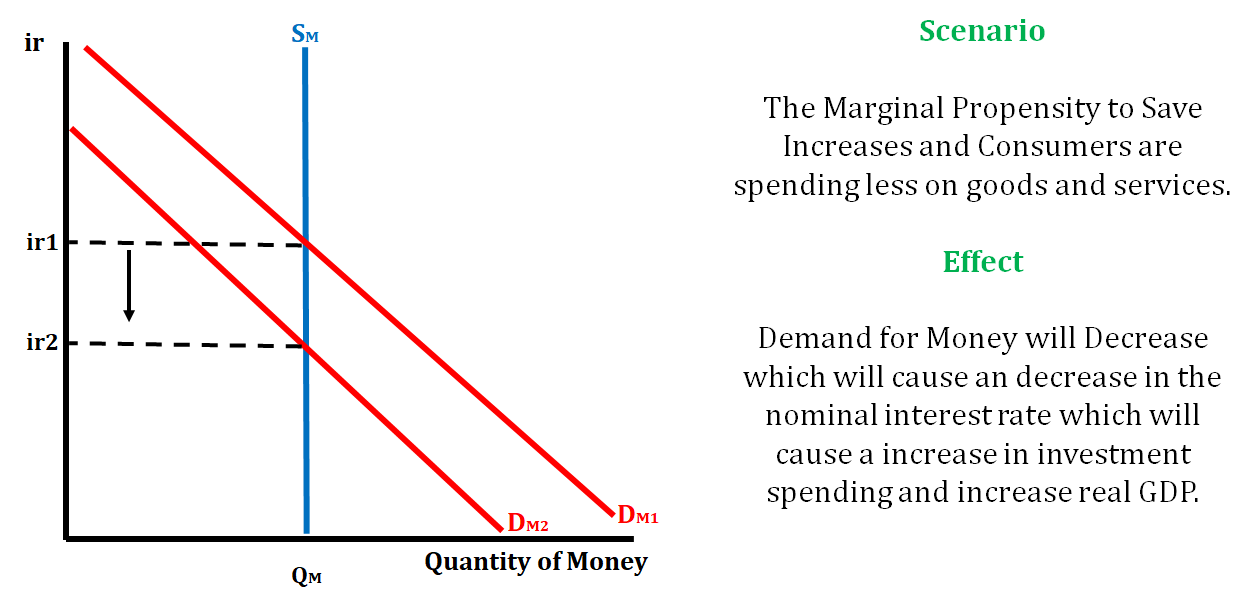
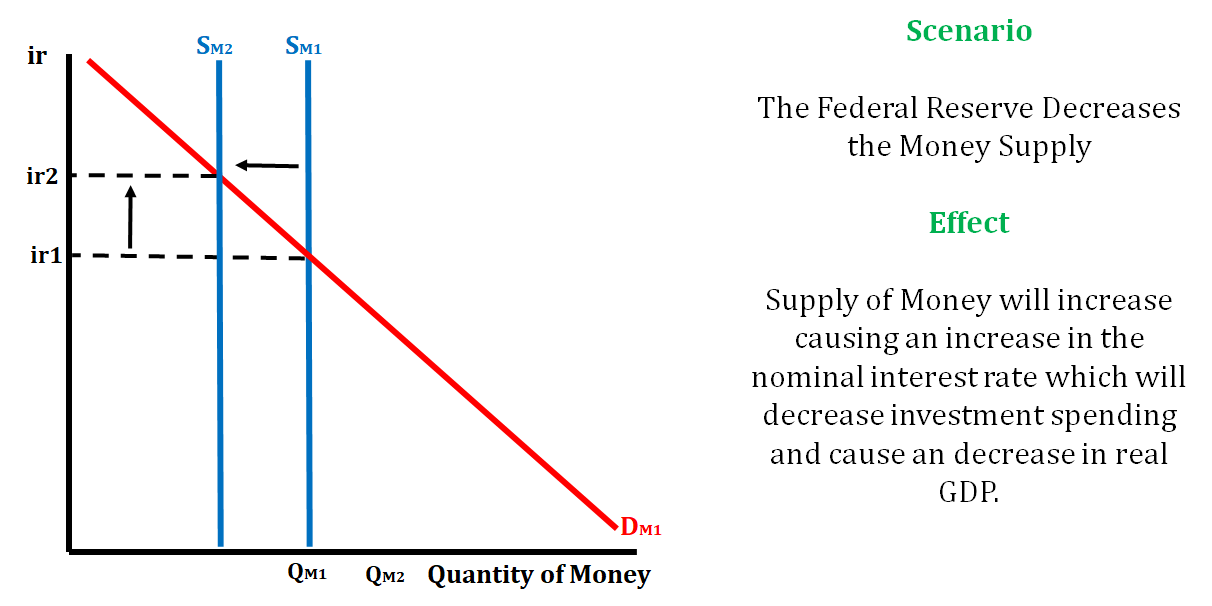
Example 2:
Example 3:
Example 4:
Investment Demand
Investment demand is the desired quantity of investment spending by firms across the economy on physical capital and other resources for the purpose of future productivity/profitability.
There is an inverse relationship between the nominal interest rate and the quantity of investment demanded. When the nominal interest rate falls, we see an increase in the quantity of investment demanded. The opposite is also true. When the nominal interest rate rises, we see a decrease in the quantity of investment demanded.
When interest rates increase, quantity of investment demanded decreases.
When interest rates decrease, quantity of investment demanded increases.
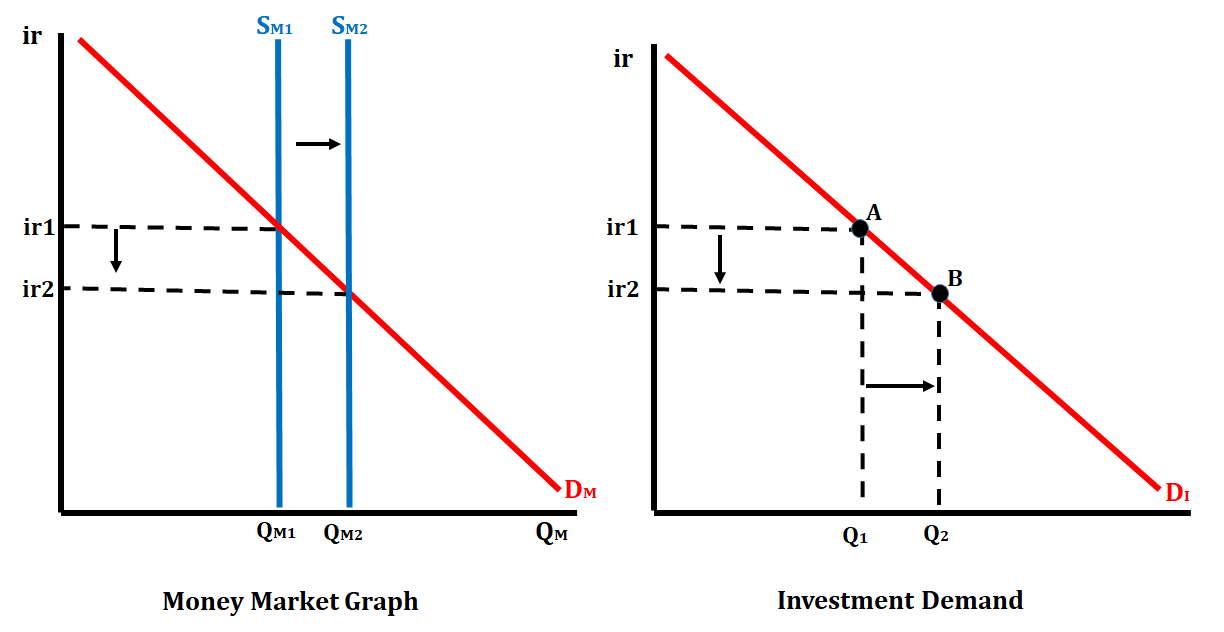
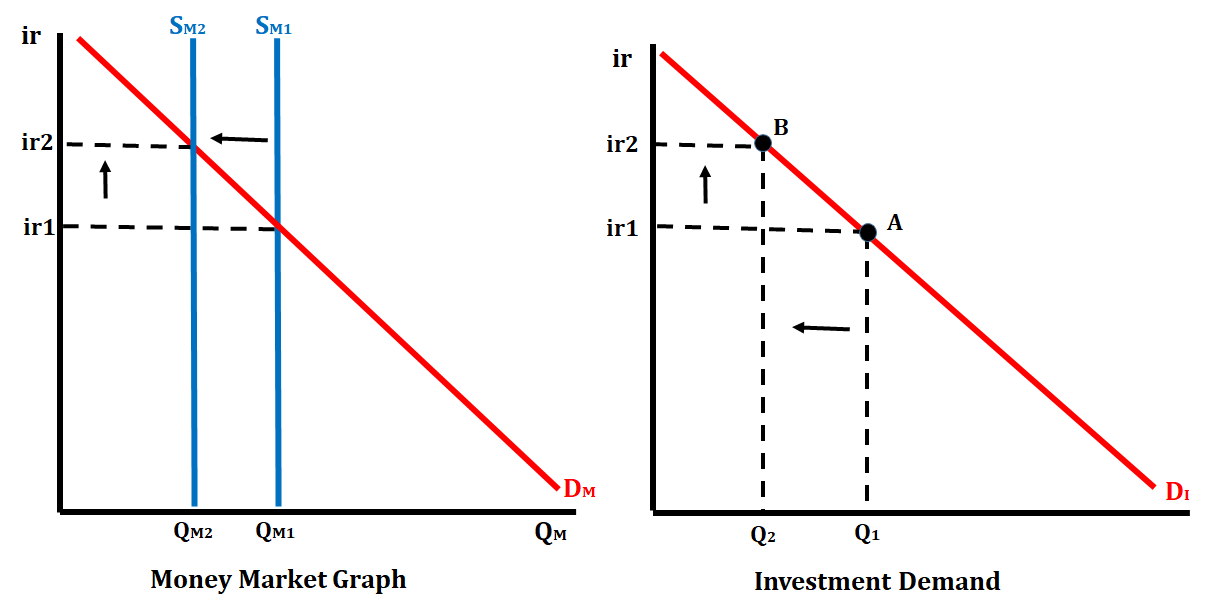
Investment demand changes due to monetary policy conducted by the Federal Reserve. When they practice an easy monetary policy and increase the money supply, they cause the nominal interest rate to fall, causing the quantity of investment demanded to increase. When they practice a tight monetary policy and decrease the money supply, they cause the nominal interest rate to increase, causing the quantity of investment demanded to decrease.
In the graph below, the Federal Reserve increases the money supply. This action will lower the nominal interest rate, and in turn, cause the quantity of investment demanded to increase.
In the graph below, the Federal Reserve decreases the money supply. This action will raise the nominal interest rate, and in turn, cause the quantity of investment demanded to decrease.
Frequently Asked Questions
What is the money market and how is it different from other markets we've studied?
The money market is the market where money (cash and checking balances) is bought and sold—more precisely, where the demand for money (liquidity preference) meets the money supply set by the central bank. On the AP CED you should show it with a downward-sloping money demand (MD) curve (inverse relationship between nominal interest rate and quantity of money demanded) and a vertical money supply (MS) curve (money supply independent of the nominal rate because the central bank controls the monetary base). Equilibrium nominal interest rate is where MD = MS; if rates are too high or low, shortages/surpluses push rates back to equilibrium. Unlike goods or loanable-funds markets, the money market focuses on liquidity and opportunity cost of holding money; shifts in MD come from price level or income changes, and shifts in MS come from open-market operations, reserve requirements, or the discount rate. Practice drawing and explaining these graphs on FRQs (CED skill 4)—see the topic study guide (https://library.fiveable.me/ap-macroeconomics/unit-4/money-market/study-guide/TZjAn5Telt9VeBrvEEZ8) and unit resources (https://library.fiveable.me/ap-macroeconomics/unit-4). For extra practice, try problems at (https://library.fiveable.me/practice/ap-macroeconomics).
How do I draw the money demand curve and why does it slope downward?
Draw axes: quantity of money (M) on the x-axis and the nominal interest rate (i) on the y-axis. Draw a downward-sloping money demand (MD) curve and label it MD. Put a vertical money supply (MS) line (set by the central bank) somewhere to intersect MD; that intersection is money-market equilibrium (i* and M*). Why MD slopes downward: there's an inverse relationship between the nominal interest rate and how much money people want to hold (EK MKT-3.A.1). Holding money gives liquidity (transactions, precautionary motives) but pays little or no interest, so the nominal interest rate is the opportunity cost of holding money. When i is high, people prefer interest-bearing assets (bonds), so quantity of money demanded falls. When i is low, holding money is cheaper, so MD rises. On the AP exam you should label axes, curves, and the equilibrium point (CED skill 4: graphing). For a focused review, see the Topic 4.5 study guide (https://library.fiveable.me/ap-macroeconomics/unit-4/money-market/study-guide/TZjAn5Telt9VeBrvEEZ8) and practice problems (https://library.fiveable.me/practice/ap-macroeconomics).
I'm confused about why money supply is vertical - can someone explain this?
Think of the money-supply curve as what the central bank sets, not something households change in response to interest rates. The CED says the central bank controls the monetary base, so for any given nominal interest rate the total money supplied is fixed by policy—that’s why MS is drawn vertical (perfectly inelastic). Money demand slopes downward because the nominal interest rate is the opportunity cost of holding money: higher rates → people hold less money (prefer bonds). Equilibrium in the money market is where the vertical MS meets downward-sloping MD; the nominal interest rate adjusts to clear any surplus or shortage (EK MKT-3.A.2, MKT-3.B.1, MKT-3.C.1). If the central bank uses open-market operations, MS shifts right or left (changing the equilibrium rate), but the curve stays vertical because supply is policy-determined. For a quick review and practice on graphs and AP-style questions, see the Topic 4.5 study guide (https://library.fiveable.me/ap-macroeconomics/unit-4/money-market/study-guide/TZjAn5Telt9VeBrvEEZ8) and Unit 4 resources (https://library.fiveable.me/ap-macroeconomics/unit-4).
What happens to interest rates when the Fed increases the money supply?
When the Fed increases the money supply, the money supply curve shifts right on the money-market graph (MS → MS2). At the initial nominal interest rate there's now a money surplus, so people try to hold that extra money by buying financial assets (like bonds). Bond prices rise and the nominal interest rate falls until money demand (which is negatively related to the nominal interest rate—EK MKT-3.A.1) equals the new money supply (equilibrium is restored—EK MKT-3.B.1 and MKT-3.C.1). Remember: the Fed controls the monetary base so the money supply is set independently of the nominal interest rate (EK MKT-3.A.2). On the AP exam, be ready to draw the MS shift, label the initial and new equilibrium interest rates, and explain the surplus → bond buying → lower interest rate adjustment. For a quick review, see the Topic 4.5 study guide (https://library.fiveable.me/ap-macroeconomics/unit-4/money-market/study-guide/TZjAn5Telt9VeBrvEEZ8) and try practice questions (https://library.fiveable.me/practice/ap-macroeconomics).
How do I know when to shift money demand vs money supply on the graph?
Shift money demand (MD) when real-world factors change people’s desire to hold cash: price level (higher P → MD right), real GDP/income (↑Y → MD right), payment habits or financial innovation, or changes in expected inflation. MD is downward sloping because the nominal interest rate is the opportunity cost of holding money (EK MKT-3.A.1). Shift money supply (MS) when the central bank acts—open market operations, reserve requirement, discount rate—because with a given monetary base MS is fixed and vertical (interest-rate independent) in the basic money-market graph (EK MKT-3.A.2, EK MKT-3.D.1). On the graph: a rightward MD shift raises the equilibrium nominal interest rate; a rightward MS shift (expansionary monetary policy) lowers it. Equilibrium is where MD and MS intersect; disequilibrium drives rates toward that intersection (EK MKT-3.B.1, MKT-3.C.1). For practice drawing and FRQ prep, see the Topic 4.5 study guide (https://library.fiveable.me/ap-macroeconomics/unit-4/money-market/study-guide/TZjAn5Telt9VeBrvEEZ8) and Unit 4 resources (https://library.fiveable.me/ap-macroeconomics/unit-4). Practice problems: (https://library.fiveable.me/practice/ap-macroeconomics).
What's the difference between nominal interest rate and real interest rate in the money market?
Nominal interest rate is the stated rate you see on loans or bonds—it’s the opportunity cost of holding money in your wallet instead of earning interest (so EK MKT-3.A.1 says money demand falls when the nominal rate rises). The real interest rate adjusts the nominal rate for expected inflation and shows the true purchasing-power cost of borrowing or lending: real ≈ nominal − expected inflation (see Topic 4.2 for more). In the money market, money supply (set by the central bank) and money demand (which depends inversely on the nominal rate) determine the equilibrium nominal interest rate (EK MKT-3.B.1). Real rates matter for investment and long-run decisions, but the money market graph uses the nominal rate to show equilibrium and short-run adjustments (EK MKT-3.C.1). Review this Topic 4.5 study guide for graphs and examples (https://library.fiveable.me/ap-macroeconomics/unit-4/money-market/study-guide/TZjAn5Telt9VeBrvEEZ8). For more practice, check the unit page (https://library.fiveable.me/ap-macroeconomics/unit-4) and the 1000+ practice problems (https://library.fiveable.me/practice/ap-macroeconomics).
Why does higher price level increase money demand - I don't get this connection?
Think of money demand as how much cash/ checking balance people need to make transactions. If the overall price level rises, every purchase costs more, so you need more money on hand to buy the same basket of goods—that’s the transactions motive. Practically, if prices double, your typical cash needs roughly double, so the demand for money shifts right. That higher money demand is shown on the money market graph as a rightward shift of the MD curve (EK MKT-3.D.1). Because money pays no interest, people weigh the opportunity cost of holding money against earning interest from bonds—so at any given nominal interest rate, a higher price level means a larger quantity of money demanded. The nominal interest rate then adjusts to restore equilibrium (EK MKT-3.B.1, MKT-3.C.1). For a quick review, see the Topic 4.5 study guide (https://library.fiveable.me/ap-macroeconomics/unit-4/money-market/study-guide/TZjAn5Telt9VeBrvEEZ8). Need practice? Try problems at (https://library.fiveable.me/practice/ap-macroeconomics).
How do I show equilibrium in the money market graph for an FRQ?
Draw a money-market graph with the nominal interest rate (r) on the vertical axis and quantity of money (M) on the horizontal. Plot money demand (MD) as a downward-sloping curve (higher r → lower quantity demanded) and money supply (MS) as a vertical line (central bank sets the monetary base; MS is independent of r)—label them and the axes. Equilibrium is the point where MD and MS intersect; label that interest rate r* and quantity M* (CED EK MKT-3.B.1). If r is above r* there’s a surplus of money (MS > MD) and market forces push r down; if r is below r* there’s a shortage and r rises until you return to r* (CED EK MKT-3.C.1). For FRQs, be sure to “draw a correctly labeled graph” and “show directional changes” when curves shift (Skill 4 requirements). For extra review and practice, see the Topic 4.5 study guide (https://library.fiveable.me/ap-macroeconomics/unit-4/money-market/study-guide/TZjAn5Telt9VeBrvEEZ8) and Unit 4 resources (https://library.fiveable.me/ap-macroeconomics/unit-4) or try practice problems (https://library.fiveable.me/practice/ap-macroeconomics).
When there's a surplus of money, do interest rates go up or down and why?
A surplus of money means at the current nominal interest rate the quantity of money supplied exceeds the quantity demanded. Because people don’t want to hold the extra money, they try to buy interest-bearing assets (like bonds). That pushes bond prices up and, since price and yield move opposite, the nominal interest rate falls. In short: a money surplus → downward pressure on nominal interest rates until money demand equals the fixed money supply (money supply is set by the central bank and is interest-rate independent per the CED). This adjustment to restore equilibrium is exactly what the money-market graph shows (EK MKT-3.A.1 and EK MKT-3.B.1). For a quick review, check the Topic 4.5 study guide (https://library.fiveable.me/ap-macroeconomics/unit-4/money-market/study-guide/TZjAn5Telt9VeBrvEEZ8) and practice problems (https://library.fiveable.me/practice/ap-macroeconomics).
What are the main factors that shift money demand curve left or right?
Money demand shifts when non-interest factors change—movements along the curve happen when the nominal interest rate changes. Main shifters (right = more money demanded; left = less): - Price level up → MD shifts right (people need more money for transactions). - Real GDP (income) up → MD shifts right (more spending → more transactions demand). - Payment technology or financial innovation (credit cards, mobile payments) → MD shifts left (less need to hold cash). - Changes in expectations about inflation or future interest rates: expecting higher inflation can reduce real money demand (left); expecting uncertainty can raise demand for liquidity (right). - Preferences for liquidity (risk aversion) increase → MD shifts right. On the AP, be ready to draw the money market (vertical MS, downward-sloping MD), show shifts and explain how nominal interest rate moves to restore equilibrium (CED EK MKT-3.*). For more review, see the Topic 4.5 study guide (https://library.fiveable.me/ap-macroeconomics/unit-4/money-market/study-guide/TZjAn5Telt9VeBrvEEZ8) and practice questions (https://library.fiveable.me/practice/ap-macroeconomics).
How does monetary policy affect the money market equilibrium?
Monetary policy changes the money supply, which shifts the (vertical) money supply curve and moves the money-market equilibrium interest rate. Because the central bank controls the monetary base, money supply is independent of the nominal interest rate (CED EK MKT-3.A.2)—so expansionary policy (open-market purchases, lower reserve requirement, lower discount rate) shifts money supply right. At a given money-demand curve (downward sloping: higher nominal interest → less money demanded, EK MKT-3.A.1), that rightward shift lowers the equilibrium nominal interest rate. Contractionary policy does the opposite: leftward shift raises nominal interest rates. If the rate is out of equilibrium you get shortages or surpluses and market forces push the nominal rate back to equilibrium (EK MKT-3.C.1). For the exam you should be able to draw a correctly labeled money-market graph showing these shifts (free-response Skill 4 tasks). Review the Topic 4.5 study guide (https://library.fiveable.me/ap-macroeconomics/unit-4/money-market/study-guide/TZjAn5Telt9VeBrvEEZ8) and practice questions (https://library.fiveable.me/practice/ap-macroeconomics).
I don't understand how disequilibrium gets corrected in the money market - help?
Think of the money market like any supply/demand market but with the nominal interest rate on the vertical axis. Money demand is downward sloping (higher r → less money held); money supply is fixed by the central bank (vertical). - If r is below equilibrium (say equilibrium 4% but r = 2%), quantity demanded > quantity supplied → a money shortage. People need cash, so they sell interest-bearing assets (like bonds). Selling bonds lowers bond prices and raises the market nominal interest rate. r rises until money demanded equals money supplied. - If r is above equilibrium (say r = 6%), quantity supplied > quantity demanded → a money surplus. People have extra cash, so they buy bonds. Buying bonds raises bond prices and lowers the nominal interest rate. r falls back to equilibrium. Market actions (buying/selling bonds) change bond prices and thus r, restoring EK MKT-3.B.1 and EK MKT-3.C.1. For more review, see the Topic 4.5 study guide (https://library.fiveable.me/ap-macroeconomics/unit-4/money-market/study-guide/TZjAn5Telt9VeBrvEEZ8), Unit 4 overview (https://library.fiveable.me/ap-macroeconomics/unit-4), and practice problems (https://library.fiveable.me/practice/ap-macroeconomics).
What's the relationship between bond prices and interest rates in money market?
They move in opposite directions: bond prices fall when nominal interest rates rise, and bond prices rise when nominal interest rates fall. Why? A bond’s fixed payments become less (or more) attractive compared to new bonds issued at the current nominal rate, so its market price adjusts so its yield matches the market interest rate. In the money market context: money supply (set by the central bank) and money demand determine the equilibrium nominal interest rate (EK MKT-3.B.1). If money demand rises (or money supply falls), the nominal interest rate rises to restore equilibrium (EK MKT-3.C.1)—that higher rate reduces prices of previously issued bonds. Conversely, expansionary monetary policy lowers interest rates and raises existing bond prices. For AP exam tasks, be ready to explain this verbally and show it on graphs of the money market and bond price/interest relationships (see Topic 4.5 study guide for review: https://library.fiveable.me/ap-macroeconomics/unit-4/money-market/study-guide/TZjAn5Telt9VeBrvEEZ8). For extra practice, try problems at (https://library.fiveable.me/practice/ap-macroeconomics).
How do I analyze what happens when both money supply and demand change at the same time?
Always draw the money-market graph (vertical MS, downward-sloping MD) and label the initial equilibrium i0 and M0—the AP free-response expects a correctly labeled graph (Skill 4). Then follow this stepwise logic: 1. Identify directions of each shift (MS right/left, MD right/left). MS shifts come from monetary policy; MD shifts come from price level, income, or payment habits (CED EK MKT-3.D.1). 2. If shifts move in opposite directions, the change in the equilibrium nominal interest rate is indeterminate without knowing magnitudes. Example: MS right and MD right → i could rise, fall, or stay the same depending on which shift is larger. 3. If shifts move the same way, the sign is clear: both right → i could be ambiguous (again depends), but equilibrium quantity of money definitely rises; both left → quantity falls. 4. Use a quick numeric or drawn comparison to show relative sizes (e.g., MS increases a lot while MD increases slightly → i falls). Always state which variable you know for sure (quantity of money changes with MS) and which may be indeterminate (i) unless magnitudes are given. For extra practice and graphs, see the Topic 4.5 study guide (https://library.fiveable.me/ap-macroeconomics/unit-4/money-market/study-guide/TZjAn5Telt9VeBrvEEZ8), the Unit 4 overview (https://library.fiveable.me/ap-macroeconomics/unit-4), and lots of practice Qs (https://library.fiveable.me/practice/ap-macroeconomics).
Can someone explain how inflation expectations affect the money market?
Short answer: higher expected inflation raises the nominal interest rate and reduces how much money people want to hold. Why: nominal i ≈ real r + expected inflation (Fisher effect). If π^e rises, nominal interest rates rise—that raises the opportunity cost of holding money (cash/bank deposits) so people hold less money. On the money-market graph this shows up as a movement up along the downward-sloping money demand curve (less quantity demanded at each i). With a fixed money supply (central bank set), the new equilibrium has a higher nominal interest rate and a lower quantity of money held. Note: if people change their desired real balances for reasons tied directly to expectations, the entire money-demand curve can shift (usually left), which alters the equilibrium depending on money supply. For AP review and practice, see the Topic 4.5 study guide (https://library.fiveable.me/ap-macroeconomics/unit-4/money-market/study-guide/TZjAn5Telt9VeBrvEEZ8) and extra practice (https://library.fiveable.me/practice/ap-macroeconomics).