The loanable funds market illustrates the interaction of borrowers and savers in the economy. Borrowers demand loanable funds, and savers supply loanable funds. The market is in equilibrium when the real interest rate adjusts to the point that the amount of borrowing equals the amount of saving.
Demand of Loanable Funds
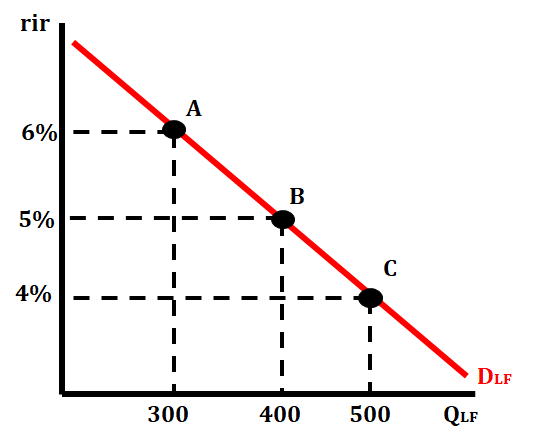
The quantity of credit wanted and needed at every real interest rate by borrowers in an economy. The relationship between real interest rates and the quantity of loanable funds demanded is inverse. As real interest rates rise, consumers and firms are less willing or less able to demand the same quantity of loanable funds, and therefore use and borrow less. As real interest rates fall, consumers and firms are more willing or more able to demand the same quantity of loanable funds, and therefore use and borrow more.
When real interest rates increase, the quantity of loanable funds demanded decreases.
When real interest rates decrease, the quantity of loanable funds demanded increases.
Shifters for the Demand Loanable Funds

Foreign Demand for Domestic Currency: When foreign investors want more of our currency to make purchases of our goods and services, we will see the demand for loanable funds increase. When we want to exchange our currency for another foreign currency, we will see a decrease in the demand for loanable funds.
All Borrowing, Lending, and Credit: When there is an increase in loans, credit, and borrowing by consumers and firms, we will see the demand for loanable funds increase. When there is a decrease in loans, credit, and borrowing by consumers and firms, we will see the demand for loanable funds decrease.
Deficit Spending: Deficit spending is when the government spends more money than they are bringing in with tax revenue. If deficit spending increases, there is an increase in the demand for loanable funds by the government to cover the additional spending not covered by tax revenues. If deficit spending decreases, there is a decrease in the demand for loanable funds because the government does not have the need for loanable funds to cover their additional spending due to tax revenues covering all spending.
Expectations for the Future: When the economy is strong and there are predictions for future growth, we will see an increase in the demand for loanable funds. In this situation, businesses are willing to borrow funds to make improvements or invest in their businesses. Consumers are also confident in the economy and are more willing to borrow funds. When there are concerns about the economy, we will see a decrease in the demand for loanable funds. In this situation, businesses will not be comfortable investing in their firms and less willing to borrow funds.

Supply of Loanable Funds
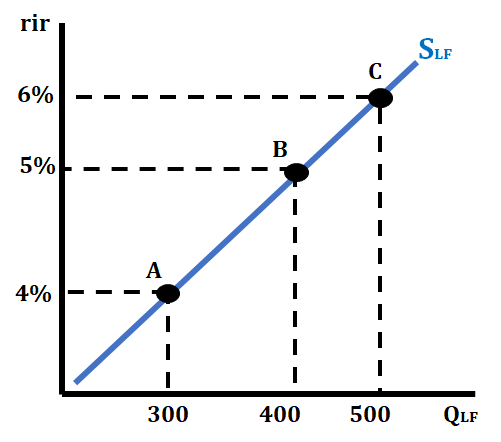
The supply of loanable funds is the quantity of credit provided at every real interest rates by banks and other lenders in an economy. The relationship between real interest rates and the quantity of loanable funds supplied is direct, or positive. As real interest rates fall, banks are less willing or less able to supply the same quantity of loanable funds, and, therefore, make less available. As real interest rates rise, banks are more willing or more able to supply the same quantity of loanable funds, and, therefore, make more available.
When real interest rates increase, the quantity of loanable funds supplied increases.
When real interest rates decrease, the quantity of loanable funds supplied decreases.
Determinants for the Supply of Loanable Funds

Savings Rate: When consumers slow their consumption and start putting more of their income into savings, the demand deposits increase. This will increase the number of reserves that banks can loan out, which will increase the supply of loanable funds. When consumers begin to increase their consumption, they are placing less of their income in the bank. This leads to fewer demand deposits and fewer reserves that can be loaned out by the government, decreasing the supply of loanable funds.
Expectations for the Future: When an economy is experiencing a contraction, consumers will begin to put more of their income into banks. This increases demand deposits and will give them greater reserves that they can loan out. This increase in reserves leads to an increase in the supply of loanable funds. If there is a high rate of inflation predicted, consumers will begin to withdraw their money from the bank in an effort to liquefy their assets and spend it on goods and services before prices rise. The pulling of their money from the banks will decrease the number of loanable funds.
Lending at the Discount Window: When the discount rate is decreased by the Federal Reserve, banks will be more willing to borrow funds, which leads to an increase in the supply of loanable funds. When the discount rate is increased by the Federal Reserve, banks will be less likely to borrow funds, which leads to a decrease in the supply of loanable funds.
Foreign Purchases of Domestic Assets: When a foreign investor chooses to increase their purchase of domestic assets like bonds, that places more money into the banking system and increases the supply of loanable funds. When a foreign investor chooses to decrease their purchase of domestic assets like bonds, that places less money into the banking system and decreases the supply of loanable funds.
Loanable Funds Market
When borrowers and lenders come together, we refer to this as the loanable funds market. We illustrate this by placing the demand and the supply of loanable funds on one graph. The real interest rate at which the quantity demanded of loanable funds equals the quantity supplied of loanable funds.
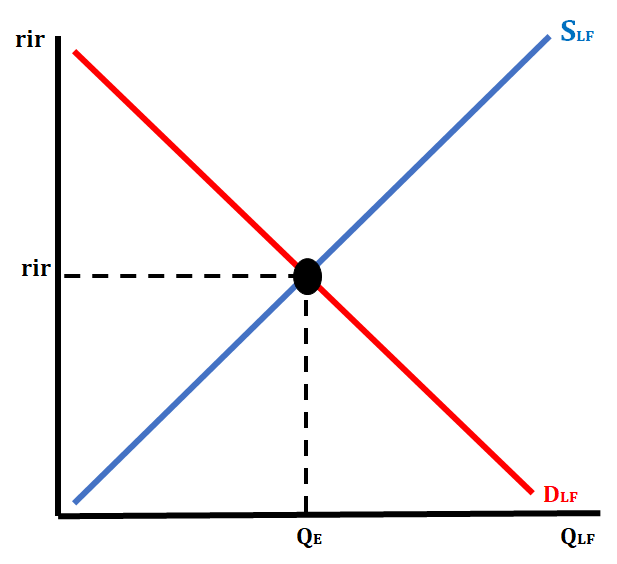
Whenever either the demand or supply of loanable funds increases or decreases then it will lead to a change in the real interest rate. This is because the equilibrium point where the quantity of loanable funds demanded and the quantity of loanable funds supplied are equal has changed.
When the demand for loanable funds increases then the real interest rate will increase.
When the demand for loanable funds decreases then the real interest rate will decrease.
When the supply of loanable funds increases then the real interest rate will decrease.
When the supply of loanable funds decreases then the real interest rate will increase.
Frequently Asked Questions
What is the loanable funds market and how does it work?
The loanable funds market is a model that shows how savers supply funds and borrowers demand funds, with the real interest rate on the vertical axis and quantity of loanable funds on the horizontal. Supply of loanable funds (savers) has a positive relationship with the real interest rate: higher real rates encourage more saving. Demand for loanable funds (borrowers/investors) has an inverse relationship: higher real rates reduce quantity demanded for investment. Equilibrium is the real interest rate where quantity supplied = quantity demanded; disequilibrium creates shortages or surpluses that drive rates toward equilibrium. Key shifts: changes in saving behavior or fiscal policy (public saving) shift supply; changes in business confidence or investment tax credits shift demand. In a closed economy, investment = public + private savings; in an open economy, investment = national savings + net capital inflow. For AP free-response, be ready to draw and label the supply/demand graph and show effects of policy (e.g., crowding out). See the Topic 4.7 study guide (https://library.fiveable.me/ap-macroeconomics/unit-4/loanable-funds-market/study-guide/AZmSR3KNHb5EmzyXRAYO) and more practice problems (https://library.fiveable.me/practice/ap-macroeconomics).
Why does demand for loanable funds slope downward but supply slopes upward?
Demand for loanable funds slopes downward because borrowers (firms and households) respond to the real interest rate: a lower real interest rate makes borrowing cheaper, so more investment projects become profitable and quantity demanded of loans rises. Supply slopes upward because savers respond to the real interest rate: a higher real interest rate gives a bigger return on saving, so more people are willing to postpone consumption and supply more funds. In AP terms: the loanable funds market shows an inverse relationship between the real interest rate and quantity demanded (EK MKT-4.A.2) and a positive relationship between the real interest rate and quantity supplied (EK MKT-4.A.3). On the exam you should be able to draw the downward-sloping demand and upward-sloping supply, label the real interest rate on the vertical axis, and explain how changes shift the curves (EK MKT-4.C/D). Review this topic’s study guide (https://library.fiveable.me/ap-macroeconomics/unit-4/loanable-funds-market/study-guide/AZmSR3KNHb5EmzyXRAYO) and practice problems (https://library.fiveable.me/practice/ap-macroeconomics).
I'm confused about the difference between nominal and real interest rates in this market - can someone explain?
Nominal interest rate = the stated % you pay or receive. Real interest rate = the nominal rate adjusted for inflation (roughly: real ≈ nominal − expected inflation). The loanable funds market uses the real interest rate on the vertical axis because borrowers and savers care about purchasing power—the real cost of borrowing and the real return to saving (CED: EK MKT-4.A, EK MKT-4.C). Example: if a loan’s nominal rate is 6% and expected inflation is 2%, the real rate ≈ 4%. That 4% is what firms compare to expected returns when they demand loanable funds; savers compare it to other uses when they supply funds. Changes in expected inflation change the nominal → real relationship and therefore shift supply or demand for loanable funds (e.g., higher expected inflation lowers real returns and tends to reduce saving at any nominal rate, shifting supply). Equilibrium is the real interest rate where quantity demanded = quantity supplied (CED: EK MKT-4.D). Want practice? Review the Topic 4.7 study guide (https://library.fiveable.me/ap-macroeconomics/unit-4/loanable-funds-market/study-guide/AZmSR3KNHb5EmzyXRAYO) and try problems in the Unit 4 practice set (https://library.fiveable.me/practice/ap-macroeconomics).
How do I know when to shift the demand curve vs supply curve in loanable funds graphs?
Shift the demand curve when something changes borrowers’ willingness or ability to borrow (investment). Shift the supply curve when something changes savers’ willingness or ability to save (national savings). Quick rules + examples: - Demand (borrowers/investment): increases from things like an investment tax credit, greater business optimism, or a larger government deficit (crowding out). A rightward demand shift raises the equilibrium real interest rate and quantity of loanable funds. (CED: EK MKT-4.E, EK MKT-4.A) - Supply (savers/national savings): increases from higher private saving, lower consumption, or policies that raise public saving (tax hikes or spending cuts); international capital inflows also raise supply in an open economy. A rightward supply shift lowers the real interest rate and raises quantity. On the AP exam you’ll need to draw these shifts and state effects on the equilibrium real interest rate and quantity (free-response Skill 4 tasks). Review examples and practice problems on Fiveable (loanable funds study guide: https://library.fiveable.me/ap-macroeconomics/unit-4/loanable-funds-market/study-guide/AZmSR3KNHb5EmzyXRAYO; unit overview: https://library.fiveable.me/ap-macroeconomics/unit-4; practice: https://library.fiveable.me/practice/ap-macroeconomics).
What's the difference between private savings and public savings in the national savings formula?
Private savings = the leftover income households have after paying taxes and consuming: Sprivate = Y − T − C. Public savings = the government’s budget position: Spublic = T − G (tax revenue minus government spending). In a closed economy national savings = Sprivate + Spublic. You can also rewrite it as Snational = Y − C − G. Key point for the loanable funds market: private + public savings supply loanable funds. If Spublic < 0 (T < G), the government runs a deficit and borrows, which reduces national saving and can “crowd out” private investment by raising the real interest rate. Example: Y=1000, T=200, C=700, G=150 → Sprivate=100, Spublic=50, Snational=150. See the AP Topic 4.7 study guide for more practice on how savings shifts supply in the loanable funds market (https://library.fiveable.me/ap-macroeconomics/unit-4/loanable-funds-market/study-guide/AZmSR3KNHb5EmzyXRAYO). For unit review: (https://library.fiveable.me/ap-macroeconomics/unit-4). For more practice problems: (https://library.fiveable.me/practice/ap-macroeconomics).
If the government increases spending, does that shift demand or supply for loanable funds?
If the government increases spending and doesn’t raise taxes enough to pay for it, it needs to borrow more. That increases the demand for loanable funds—the gov’t is another borrower—so the demand curve shifts right. Real interest rates rise and the quantity of loanable funds at the new equilibrium increases; higher rates can “crowd out” some private investment. The supply of loanable funds only shifts if saving behavior changes (private saving or public saving changes because of tax policy). For AP CED alignment: this is exactly EK MKT-4.E.1 (effects of government spending/borrowing) and relates to equilibrium changes in the loanable funds market (EK MKT-4.C/D). For a quick review, see the Topic 4.7 study guide (https://library.fiveable.me/ap-macroeconomics/unit-4/loanable-funds-market/study-guide/AZmSR3KNHb5EmzyXRAYO) and try practice questions (https://library.fiveable.me/practice/ap-macroeconomics).
How does an investment tax credit affect the loanable funds market graph?
An investment tax credit makes investment more attractive, so firms want to borrow more. In the loanable funds market that increases demand for loanable funds—shift the demand curve right. Equilibrium real interest rate rises and the equilibrium quantity of loanable funds increases. On a correctly labeled graph (real interest rate on vertical axis, quantity of loanable funds on horizontal), show D shifting right from D1 → D2; r rises from r1 → r2 and Q from Q1 → Q2. Note: higher interest rates can partially crowd out other private investment. For AP free-response, be prepared to draw and label the shift and explain how r adjusts to restore equilibrium (Skill 4: Create graphs/visuals). Review Topic 4.7 study guide here (https://library.fiveable.me/ap-macroeconomics/unit-4/loanable-funds-market/study-guide/AZmSR3KNHb5EmzyXRAYO), the Unit 4 overview (https://library.fiveable.me/ap-macroeconomics/unit-4), and practice problems (https://library.fiveable.me/practice/ap-macroeconomics).
I don't understand how equilibrium works in the loanable funds market - what happens when there's a surplus or shortage?
Equilibrium in the loanable funds market is the real interest rate where quantity supplied (savers) equals quantity demanded (borrowers). If the real interest rate is above that equilibrium, supply > demand → a surplus of loanable funds. Lenders compete to attract borrowers, so the real interest rate falls toward equilibrium. If the real interest rate is below equilibrium, demand > supply → a shortage of loanable funds. Borrowers compete for scarce funds, pushing the real interest rate up toward equilibrium. In AP terms, use a supply curve (upward sloping) and demand curve (downward sloping); disequilibrium creates forces that move the real interest rate to the point where quantities are equal (CED EK MKT-4.C.1 and EK MKT-4.D.1). You’ll need to draw and explain this on free-response questions, so practice graphing shifts and adjustments (see the Topic 4.7 study guide (https://library.fiveable.me/ap-macroeconomics/unit-4/loanable-funds-market/study-guide/AZmSR3KNHb5EmzyXRAYO) and more practice problems (https://library.fiveable.me/practice/ap-macroeconomics)).
What happens to interest rates when people start saving more money?
If people save more, the supply of loanable funds increases—on the loanable funds graph the supply curve shifts right. Because supply and demand determine the equilibrium real interest rate (CED EK MKT-4), that rightward shift lowers the equilibrium real interest rate and raises the equilibrium quantity of loanable funds (more loans are made at a lower real rate). In a closed economy this is just higher national savings (private + public), which finances more investment; in an open economy some of the extra funds can become net capital outflow. You should be able to draw this for AP FRQs: label the real interest rate on the vertical axis, loanable funds on the horizontal, show S shifting right, and show lower r* and higher Q* (CED EK MKT-4.A–E). For a quick review, see the Topic 4.7 study guide (https://library.fiveable.me/ap-macroeconomics/unit-4/loanable-funds-market/study-guide/AZmSR3KNHb5EmzyXRAYO) and practice problems (https://library.fiveable.me/practice/ap-macroeconomics).
How do budget deficits affect the loanable funds market?
A higher government budget deficit reduces public saving, so national saving falls and the supply of loanable funds shifts left. On a loanable-funds graph (supply leftward, demand unchanged) the equilibrium real interest rate rises and the equilibrium quantity of loanable funds (and thus investment) falls—that reduction in private investment is called crowding out. In an open economy, higher domestic interest rates can attract net capital inflows, which partially offset the supply fall, but some crowding out usually remains. On the AP exam you should be ready to draw and label this: S shifts left, r (real interest rate) up, Q down, and explain the mechanism (public saving → supply; higher r → lower investment). For a quick review, see the Topic 4.7 study guide (https://library.fiveable.me/ap-macroeconomics/unit-4/loanable-funds-market/study-guide/AZmSR3KNHb5EmzyXRAYO) and Unit 4 resources (https://library.fiveable.me/ap-macroeconomics/unit-4). For extra practice, try the 1,000+ AP problems (https://library.fiveable.me/practice/ap-macroeconomics).
What's the difference between a closed economy and open economy when calculating national savings?
In a closed economy (no international borrowing/lending) national saving = private saving + public saving. You can also write it from GDP: S = Y - C - G, and S must equal investment (I). That’s the AP CED point: national saving funds domestic investment in the loanable funds market. In an open economy, countries can borrow or lend abroad. The saving–investment identity becomes I = S + NCI (net capital inflow). Rearranged: S = I - NCI. So national saving is still private + public saving, but it no longer has to equal domestic investment—if NCI > 0 the country borrows from abroad (I > S); if NCI < 0 it lends abroad (I < S). Know both forms for AP free-response: define national savings in closed vs open terms and show how NCI links saving and investment (see the Topic 4.7 study guide) (https://library.fiveable.me/ap-macroeconomics/unit-4/loanable-funds-market/study-guide/AZmSR3KNHb5EmzyXRAYO). For extra practice, try problems at Fiveable (https://library.fiveable.me/practice/ap-macroeconomics).
Why do higher interest rates make people want to save more but borrow less?
Higher real interest rates change the incentives in the loanable funds market. For savers (supply): a higher real interest rate raises the return you get from saving, so saving becomes more attractive vs. spending—the quantity of loanable funds supplied increases (EK MKT-4.A.3). For borrowers (demand): a higher real interest rate raises the cost of borrowing, so fewer investment projects or big purchases have expected returns that exceed that cost—the quantity of loanable funds demanded falls (EK MKT-4.A.2). Put another way: saving gets a bigger payoff, and borrowing gets more expensive, so supply shifts up the curve while demand moves down along its curve until the market reaches an equilibrium real interest rate (EK MKT-4.C.1). For AP review, see the Topic 4.7 study guide (https://library.fiveable.me/ap-macroeconomics/unit-4/loanable-funds-market/study-guide/AZmSR3KNHb5EmzyXRAYO) and try practice problems (https://library.fiveable.me/practice/ap-macroeconomics).
Can someone explain how net capital inflow fits into the loanable funds model?
Net capital inflow (NCI) is how much a country borrows from foreigners—net foreign purchases of domestic assets. In the loanable-funds model for an open economy, investment = national savings + net capital inflow (CED EK MKT-4.B.2). Practically that means the supply of loanable funds available for domestic investment = national saving + NCI. So if NCI rises (more foreign lending to your country), the supply curve of loanable funds shifts right → equilibrium real interest rate falls and the equilibrium quantity of loanable funds (and investment) rises. Conversely, if NCI falls (capital flees), supply shifts left, interest rates rise and investment falls. This is why a bigger government deficit may not raise domestic interest rates as much if it’s met by higher NCI (less crowding-out). You should be able to show this on the loanable-funds graph and state the savings-investment identity for an open economy (AP exam skill EK MKT-4.C / MKT-4.B). For a quick review, see the Topic 4.7 study guide (https://library.fiveable.me/ap-macroeconomics/unit-4/loanable-funds-market/study-guide/AZmSR3KNHb5EmzyXRAYO) and Unit 4 resources (https://library.fiveable.me/ap-macroeconomics/unit-4). Practice related problems at (https://library.fiveable.me/practice/ap-macroeconomics).
How do I draw a graph showing what happens when both government spending increases and people save more at the same time?
Draw the loanable funds market: vertical axis = real interest rate (r), horizontal = quantity of loanable funds (Q). Start with downward-sloping demand (D0) and upward-sloping supply (S0) meeting at E0 (r0, Q0). - If government spending ↑ and it’s financed by borrowing, demand for loanable funds shifts right: D0 → D1 (more borrowing). - If people save more, supply of loanable funds shifts right: S0 → S1 (more saving). On the graph show both shifts simultaneously. The equilibrium quantity of loanable funds unambiguously increases (Q0 → Q1). The new real interest rate is indeterminate without magnitudes: if D shift > S shift, r rises (greater crowding out of private investment); if S shift > D shift, r falls; if equal, r unchanged. When you draw for the AP free-response, label axes, curves, and both old/new equilibria and state the ambiguous effect on r (CED skill 4.C, 4.D). For extra review see the Topic 4.7 study guide (https://library.fiveable.me/ap-macroeconomics/unit-4/loanable-funds-market/study-guide/AZmSR3KNHb5EmzyXRAYO), Unit 4 overview (https://library.fiveable.me/ap-macroeconomics/unit-4), and practice problems (https://library.fiveable.me/practice/ap-macroeconomics).
What real world events would cause the supply of loanable funds to shift left?
Supply of loanable funds shifts left when savers supply fewer funds at every real interest rate—in AP terms, national (or private) saving falls. Real-world causes include: - A drop in private saving: households save less because of lower income, higher consumption, or a higher marginal propensity to consume (e.g., after a wage shock or stimulus checks). - Larger government budget deficits (higher G or big tax cuts): public saving falls, so national saving declines and supply shifts left. - Financial crises or bank runs: people hoard cash or banks cut lending, reducing available loanable funds. - Capital outflows or loss of foreign investor confidence: foreign lending into your country falls, cutting supply in an open economy. - Increased uncertainty/expectations of higher inflation: savers withdraw from lending or prefer other assets. Graphically (CED EK MKT-4.A/C/E), supply left → equilibrium real interest rate rises and quantity of loanable funds falls (crowding out investment). For review, see the Topic 4.7 study guide (https://library.fiveable.me/ap-macroeconomics/unit-4/loanable-funds-market/study-guide/AZmSR3KNHb5EmzyXRAYO) and extra practice (https://library.fiveable.me/practice/ap-macroeconomics).