Interactions between solvents and solutes can be represented with particle/molecule diagrams. Remember that the solute is the substance that is dissolved, while the solvent is the substance that does the dissolving.
Particulate Representations of Solutions
Particulate representations are powerful tools for understanding solutions at the molecular level. These diagrams show:
- Relative concentrations of components (more particles = higher concentration)
- Interactions between solute and solvent particles
- Distribution of particles throughout the solution

Representing Concentrations
When drawing particulate diagrams of solutions with different concentrations:
- Dilute solutions: Show few solute particles spread far apart among many solvent molecules
- Concentrated solutions: Show many solute particles relative to solvent molecules
- Saturated solutions: Show the maximum number of dissolved solute particles possible
For example, if you're comparing 0.1 M NaCl to 1.0 M NaCl, the 1.0 M solution diagram would show 10 times as many Na⁺ and Cl⁻ ions per unit volume.
Representing Interactions
Particulate diagrams should illustrate how solute and solvent particles interact:
- Ion-dipole interactions: Show water molecules oriented with their oxygen (negative) ends toward cations and hydrogen (positive) ends toward anions
- Hydrogen bonding: Draw dotted lines between hydrogen bond donors and acceptors
- Solvation shells: Show how solvent molecules surround and stabilize solute particles
👉 Want to read more about solutions before continuing on? Go back to the last key topic: Solutions and Mixtures.
Types of Solutions
Solutions in which water is the dissolving medium, or solvent, are called aqueous solutions💧.
- Any substance whose aqueous solution contains ions is called an electrolyte.
- Any substance that forms a solution containing no ions is a nonelectrolyte.
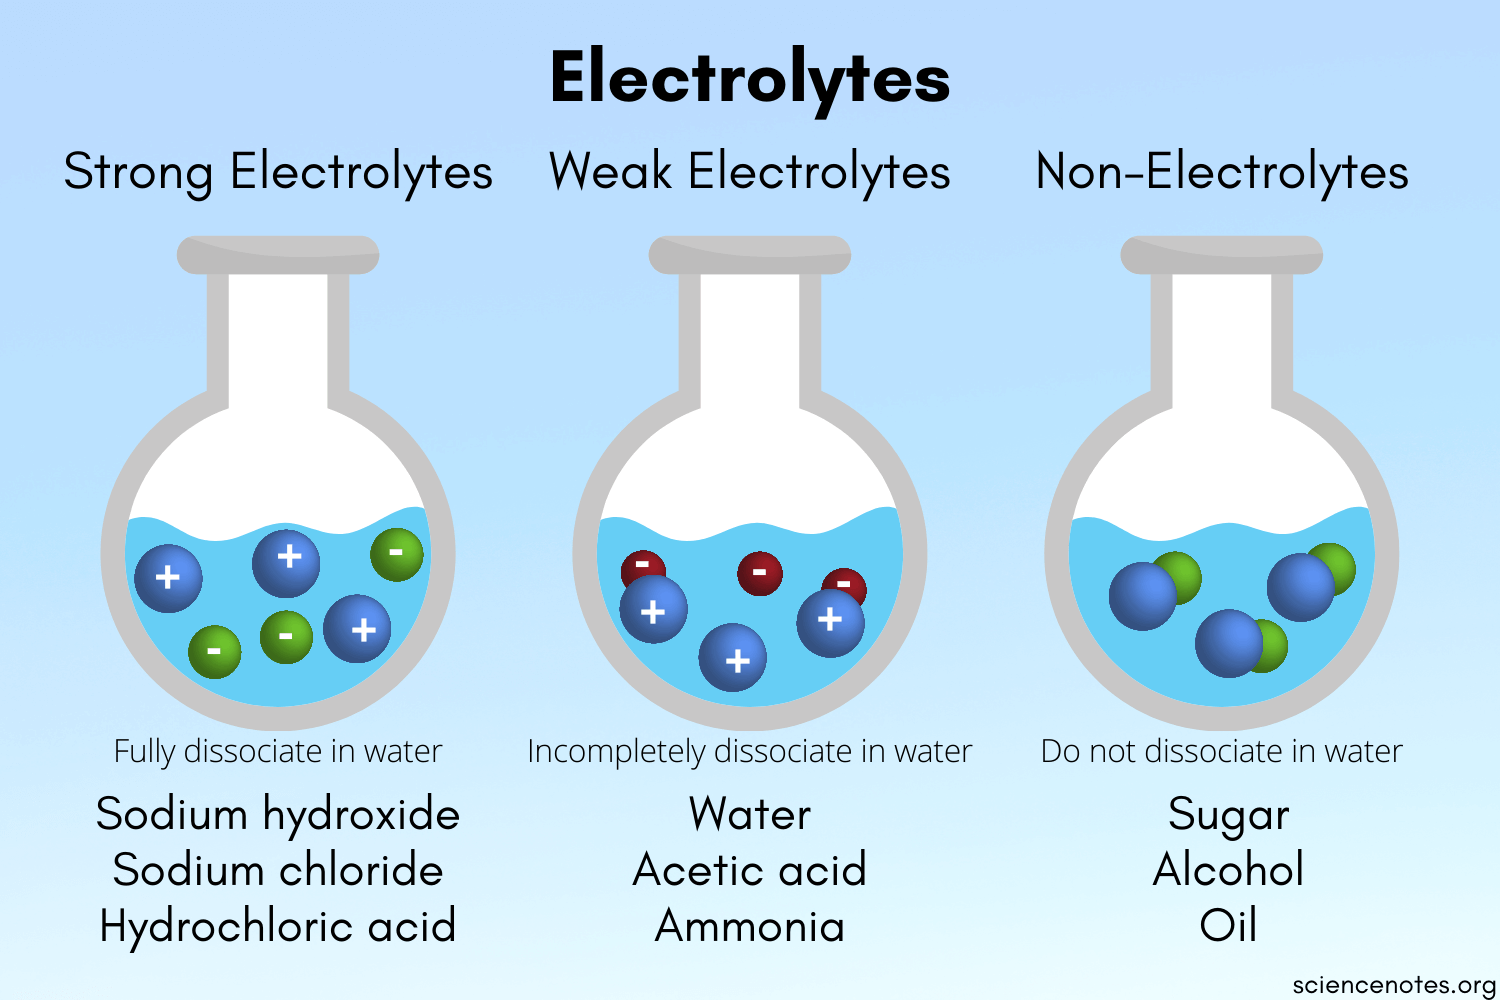
⚡ Electrolytes
Electrolytes are substances that would generate electricity in a solution. This is explained by the presence of ions in the solution, and ions can carry an electric current. If a substance is an electrolyte, it can be either strong or weak:
- Strong electrolytes are substances that completely dissolve in water into their constituent ions. To explain this, we say that strong electrolytes completely dissociate in an aqueous solution. To dissociate is to simply split up into the respective cations and anions.
- Strong electrolytes include soluble salts, strong acids, and strong bases. - Soluble salts include sodium chloride (NaCl) and potassium chloride (KCl).
- The strong acids and bases that you have to know in this course are found in the table below
- Let's take a look at the strong acid HCl as an example of a strong electrolyte. The dissolution of hydrochloric acid in water can be represented by the following: HCl (aq) + H2O (l) --> H+ (aq) + Cl- (aq).
- This reaction proceeds until there is no more HCl, meaning if you were to dissolve five moles of HCl in water, you would find that there are five moles of hydrogen ions and chloride ions in the end.
| Strong Acids | Strong Bases |
|---|---|
| HCl | CaOH |
| HBr | SrOH |
| HI | BaOH |
| HNO₃ | any group 1 metal + OH⁻ |
| H₂SO₄ | |
| HClO₃ | |
| HClO₄ |
- Weak electrolytes are substances that only partially dissociate in water and conduct electricity, but not as strongly as strong electrolytes. Since these partly dissociate in a solution of water, only some molecules would split up into their ions.
- Weak electrolytes include weak acids and weak bases.
- Acetic acid, CH₃COOH, is a weak acid and weak electrolyte. The dissolution of acetic acid in water can be represented by the following chemical equation: CH₃COOH (aq) + H2O (l) --> H+ (aq) + CH3COO- (aq). This reaction does not completely proceed. In other words, only some of the acetic acid will dissolve into hydrogen and acetate.
- Nonelectrolytes are molecular compounds that do not conduct electricity since there are no ions present that can carry an electric current. An example would be sugar.
Acids and Bases 🍊
The solubility of ionic substances is made possible by solvation, the process of a solvent dissolving a solute to form a solution.
Acids and bases are critical electrolytes as mentioned above. Acids are proton donors; they increase the concentration of H+ (aq). Bases, on the other hand, are proton acceptors; they increase the concentration of OH- (aq). Knowing the basic properties of these electrolytes can help you recognize compounds that are in certain solutions.
Acids and bases will be looked at further in both unit four about chemical reactions and unit eight which is all about them!
Visualizing Solutions
When knowing how different solutions act regarding electrolytes, acids, and bases, you can visualize how particles interact in a solution:
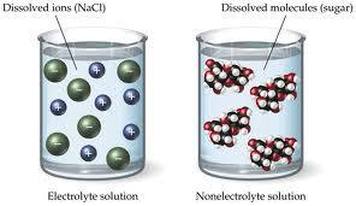
In the above images, you can see two dissolved substances, one being a strong electrolyte and the other being a non-electrolyte. Since the NaCl solution shows dissolved ions, we know that it will conduct electricity.
Key Features in Particulate Diagrams
When interpreting or drawing particulate representations of solutions, look for:
-
For ionic solutes in water:
- Separated cations and anions (not ion pairs)
- Water molecules oriented around ions (ion-dipole interactions)
- Oxygen end of water pointing toward cations
- Hydrogen end of water pointing toward anions
-
For molecular solutes:
- Intact molecules (not dissociated)
- If polar: water molecules oriented to interact with polar regions
- If nonpolar: minimal specific orientation of water molecules
-
Concentration differences:
- Higher concentration = more solute particles per unit volume
- Equal volumes should be compared when showing concentration differences
- Maintain proper solute-to-solvent ratios
Example: Comparing Different Concentrations
Imagine three beakers containing:
- Beaker A: 0.1 M sugar solution
- Beaker B: 0.5 M sugar solution
- Beaker C: 0.1 M NaCl solution
In particulate diagrams:
- Beaker B would show 5 times more sugar molecules than Beaker A (same volume)
- Beaker C would show the same total number of particles as Beaker A, but they would be Na⁺ and Cl⁻ ions instead of intact molecules
- Water molecules in Beaker C would be oriented around the ions, while in Beakers A and B they would surround the sugar molecules through hydrogen bonding
Colligative Properties
⚠️ According to the AP Chemistry Course Exam and Description provided by College Board, colligative properties will not be assessed on the AP exam. We are going to discuss them just in case your teacher goes over them though.
When discussing solutions, colligative properties are properties that depend upon the concentration of solute molecules or ions, but not upon the identity of the solute. For example, a solution of 6M NaCl will act a lot differently than simply pure water.
There are three main colligative properties, but you may also learn about osmotic pressure.
Vapor-Pressure Lowering
The vapor pressure of a solution is lower than the vapor pressure of a pure solvent. When a solute is dissolved in a solvent, you decrease the tendency for water molecules to evaporate into the gas phase. This means that there will be less gas above the surface of the liquid, leading to lower vapor pressure.
There is a formula for finding the exact new vapor pressure:
Raoult's Law: P1 = XP0, where P1 is the new vapor pressure, X is the mole fraction of the solute, and P0 is the initial vapor pressure.
Boiling-Point Elevation
The boiling point of a solution is higher than the boiling point of the pure solvent. Applying a non-volatile solution decreases the solution's vapor pressure by Raoult's Law. Then, the temperature must be increased to return the vapor pressure to the pure solvent value. This means that as you add more and more solute, the temperature at which the solution boils increases.
A good example of this is when you make pasta. Chefs around the world always recommend that you salt your water before you add pasta, and while this of course is to add flavor, it also actually raises the boiling point of your water, making your pasta cook quicker!
This same principle is seen in chemistry with solutions. There is another formula to calculate the exact elevation.
ΔTb = km, where ΔTb is the change in boiling point, k is a specific constant, and m is the molality of the solute (molality is a measure of concentration that is mol solute/kg solvent).
Freezing-Point Depression
The same applies to freezing points of solutions. As the boiling point elevates, the freezing point depresses, or lowers. Therefore, the freezing point of a solution is lower than the freezing point of the pure solvent.
This means that, for example, a solvent may have a freezing point of 0 degrees Celsius without any solute, and then once you dissolve some solute, the freezing point will lower to -1.5 degrees Celsius.
A good example of this is if you live in the North, you are well accustomed to adding salt to ice in order to melt it. The key reason for this is not a reaction occurring, but the freezing point of the ice decreasing, turning it back to a liquid.
Fun fact: The salt that melts ice on the streets is not NaCl! It's typically CaCl2 since it will split into more solute particles, thus decreasing the freezing point even more! NaCl splits up into two ions, whereas CaCl2 splits up into 3 ions.
The formula for freezing-point depression is very similar to boiling-point elevation; it is ΔTf = -km.
🎥 Watch Jacob Jeffries discuss solubility and representations of solutions.
Frequently Asked Questions
What is a particulate model and why do we use them for solutions?
A particulate model is a drawing that shows individual atoms, ions, or molecules in a mixture—their sizes, relative numbers, and how they interact. For solutions we use particulate models because they let you visualize (1) concentration (lots of solute particles vs. few), and (2) specific solute–solvent interactions (solvation/hydration shells, ion-dipole for ions in water, H-bonding for polar solutes, dispersion for nonpolar solutes). Those visuals connect microscopic behavior to macroscopic properties and help you decide whether a substance is an electrolyte (ions separate) or a nonelectrolyte, or whether ion pairing, saturation, or dynamic equilibrium is present—all explicit in the CED (3.8.A.1). Particulate diagrams are exactly the kind of model Practice 1/Model & Representations tests on the AP (Unit 3). For more examples and practice, see the Topic 3.8 study guide (https://library.fiveable.me/ap-chemistry/unit-3/representations-solutions/study-guide/O4uZStuqpe603GRuztjG) and the AP Chem practice set (https://library.fiveable.me/practice/ap-chemistry).
How do I draw particles in a solution to show concentration?
Draw a box and fill it with lots of solvent particles (for water, show small H2O shapes or circles with a dipole). Represent concentration by the number of solute particles relative to solvent: a dilute solution = few solute particles spread out; concentrated = many solute particles crowded. For ionic solutes (electrolytes) show dissociated ions (Na+ and Cl−) surrounded by hydration shells (water dipoles oriented: O toward cation, H toward anion) to show ion–dipole interactions. For molecular solutes in a polar solvent show hydrogen bonding or dipole–dipole orientations; in a nonpolar solvent show solute particles clustered with dispersion interactions. To show saturation, draw undissolved solid at the bottom plus dissolved particles in equilibrium. Label species and interactions (hydration shell, ion pairing if appropriate). These particulate diagrams should communicate both relative concentrations and solute–solvent interactions (CED 3.8.A; keywords: solvation, hydration shell, ion–dipole, hydrogen bonding). For more examples, check the Topic 3.8 study guide (https://library.fiveable.me/ap-chemistry/unit-3/representations-solutions/study-guide/O4uZStuqpe603GRuztjG) and practice problems (https://library.fiveable.me/practice/ap-chemistry).
What's the difference between showing a concentrated solution vs a dilute solution in particle diagrams?
A concentrated solution vs a dilute solution in a particle diagram is mainly about relative numbers and interactions. For a concentrated diagram show many more solute particles per solvent particle (higher solute:solvent ratio)—dots/ions closer together and more frequently solvated. For a dilute diagram show far fewer solute particles among lots of solvent particles (solute widely spaced). For ionic solutes draw dissociated ions with hydration/solvation shells and ion–dipole interactions; for molecular solutes show solvent molecules oriented for hydrogen bonding or dipole–dipole if appropriate, or little interaction for nonpolar solutes (dispersion). If the CED asks you to represent interactions and concentrations (3.8.A.1), include both: particle counts for concentration and drawn solvation shells/orientation for interactions. For more examples and practice drawing particulate models, see the Topic 3.8 study guide (https://library.fiveable.me/ap-chemistry/unit-3/representations-solutions/study-guide/O4uZStuqpe603GRuztjG) and unit resources (https://library.fiveable.me/ap-chemistry/unit-3). For extra practice questions, try the AP practice set (https://library.fiveable.me/practice/ap-chemistry).
I'm confused about how to represent interactions between solute and solvent particles - can someone explain?
Think of particulate diagrams as tiny scene sketches that show who’s next to who and how they interact. How to represent solute–solvent interactions (quick rules): - Draw solvent molecules (water as small polar dipoles) surrounding solute particles. For ions (Na+, Cl–), show hydration shells with solvent dipoles oriented so opposite partial charges point toward the ion—this represents ion–dipole (hydration) interactions and ionic dissociation. - For polar molecular solutes (glucose), show H-bonding or dipole–dipole contacts between solute and solvent (dashed lines). Label partial charges δ+ / δ– when helpful. - For nonpolar solutes in nonpolar solvents, show close packing with no dipole orientation—dispersion forces dominate. - For ionic solutions, indicate electrolyte vs nonelectrolyte behavior, and optionally show occasional ion pairing if concentration is high. - For saturated solutions, show dissolved particles in equilibrium with undissolved solid (dynamic exchange arrows). These are exactly the particulate-model skills tested in Topic 3.8—practice sketching NaCl(aq), sugar(aq), and oil in hexane to build fluency. For the AP study guide and lots of examples, see the Topic 3.8 study guide (https://library.fiveable.me/ap-chemistry/unit-3/representations-solutions/study-guide/O4uZStuqpe603GRuztjG). Need more practice? Try the AP practice problem set (https://library.fiveable.me/practice/ap-chemistry).
Why do we need to know about particle representations of solutions?
You need particle representations because they let you “see” what’s happening at the molecular/ionic level—which the AP expects you to do. Particulate models show relative concentrations, solute–solvent interactions (ion-dipole, hydrogen bonding, dispersion), hydration shells, ionic dissociation vs. ion pairing, and whether a solution is saturated/unsaturated/supersaturated (dynamic equilibrium). Those visual cues help you predict solubility, why electrolytes conduct, and how concentration changes behavior—all skills tied to the Course and Exam Description (Practice 1: Models & Representations). The AP won’t ask you to compute molality or % composition here, but it will ask you to draw and interpret particulate diagrams that communicate interactions and concentrations (CED Topic 3.8.A.1). For targeted review, see the Topic 3.8 study guide (https://library.fiveable.me/ap-chemistry/unit-3/representations-solutions/study-guide/O4uZStuqpe603GRuztjG) and practice more problems at (https://library.fiveable.me/practice/ap-chemistry).
How do I show the difference between ionic and molecular compounds dissolving in water using particle models?
Draw two separate particle diagrams and label them with concentrations (lots of solvent = many water dots). - Ionic compound (e.g., NaCl): show the solid lattice on left (Na+ and Cl– touching). Then in solution show many separate Na+ and Cl– ions spaced apart, each surrounded by water molecules oriented to make hydration shells (oxygen toward Na+, hydrogen toward Cl–). Add arrows or labels: “ion-dipole interactions,” “electrolyte,” and “ionic dissociation.” Vary number of ion particles to show concentration. - Molecular compound (e.g., sugar): show intact neutral molecules (clusters of molecular shapes) dispersed among water. Draw water molecules hydrogen-bonded to polar parts of the solute (label “hydrogen bonding” or “dipole–dipole”), or show weak dispersion contacts if the solute is nonpolar. Label “nonelectrolyte” (no free ions). Emphasize: ionic = dissociates to ions + strong ion-dipole; molecular = stays as whole molecules + H-bonding/dipole or dispersion. Use these particulate diagrams to show both interactions and relative concentrations per CED 3.8.A. For more examples and practice, see the Topic 3.8 study guide (https://library.fiveable.me/ap-chemistry/unit-3/representations-solutions/study-guide/O4uZStuqpe603GRuztjG) and extra problems (https://library.fiveable.me/practice/ap-chemistry).
What does it mean when particles are "interacting" in a solution diagram?
“Interacting” in a solution diagram means the particles are exerting attractive or repulsive forces on each other—not just sitting randomly. Particulate drawings show those interactions by placing solvent molecules around solute particles (hydration/solvation shells), drawing dashed lines or close contacts, or orienting polar molecules so positive ends face negative ions. Common types: ion–dipole (ions with polar solvents), hydrogen bonding (H—O, H—N with polar solvents), dispersion forces (between nonpolar species), and ion pairing (oppositely charged ions close together). These interactions explain solubility and behavior and are exactly what the CED expects you to represent (3.8.A.1). On the AP exam, label the force type and show orientation or shells to earn full credit. For quick review and examples of diagrams, see the Topic 3.8 study guide (https://library.fiveable.me/ap-chemistry/unit-3/representations-solutions/study-guide/O4uZStuqpe603GRuztjG). Practice problems are at (https://library.fiveable.me/practice/ap-chemistry).
How do I draw a particulate model that shows both concentration and particle interactions?
Show concentration by particle count/spacing and show interactions with labeled dashed lines. - Start with a box representing the solution. Pick a scale (e.g., 1 dot = 1 solute particle). Draw many solvent particles (small circles) and fewer/more solute particles to reflect dilute vs concentrated—density and spacing communicates concentration. Add a short key/legend. - Show solute identity: neutral molecules (draw dipoles with +/– ends for polar), ions (+/–), or nonpolar spheres. - Represent interactions: draw dashed lines between ion and solvent dipoles for ion–dipole (label it), curved H—O··· for hydrogen bonds, and short wavy lines for dispersion. For ions include explicit hydration shells (solvent molecules oriented toward ion). - For ionic electrolytes show dissociation into separate ions; for concentrated solutions show some ion pairing (opposite ions close together). - If relevant, label saturated/unsaturated (some undissolved solid at bottom = saturated). - Keep it neat: color or shading, legend, and a note of relative concentrations (e.g., [solute] = low/high). This matches the AP CED objective 3.8.A (represent interactions and concentrations). For examples and practice drawing tips see the Topic 3.8 study guide (https://library.fiveable.me/ap-chemistry/unit-3/representations-solutions/study-guide/O4uZStuqpe603GRuztjG). For unit review and extra practice questions, check the unit page (https://library.fiveable.me/ap-chemistry/unit-3) and the full practice set (https://library.fiveable.me/practice/ap-chemistry).
I don't understand how to represent relative concentrations in particle drawings - help?
Think of a particulate drawing like a snapshot: the number of solute particles vs solvent particles shows concentration. Quick rules that match the CED (3.8.A): - Pick a consistent scale (e.g., 1 large solvent dot = 10 water molecules). Draw many more solvent dots than solute for a dilute solution; a few solute dots among many solvent dots for dilute, roughly equal numbers for concentrated, and lots of solute with little free solvent for saturated/supersaturated. - Show solvation/hydration shells: place solvent dipoles oriented around ions (ion–dipole) or polar molecules hydrogen-bonded to polar solute. For nonpolar solutes in a polar solvent show little interaction and separate clusters (dispersion forces). - For electrolytes draw dissociated ions spaced with hydration shells; include occasional ion pairs if relevant. - Always include a legend (what each symbol and scale means) and label interactions (ion–dipole, H-bond, dispersion). - On the AP exam they want accurate relative counts and correct interactions in your drawing, not exact mole calculations (CED 3.8.A.1). Practice making a few examples (dilute vs concentrated vs saturated) and check work against the topic study guide (https://library.fiveable.me/ap-chemistry/unit-3/representations-solutions/study-guide/O4uZStuqpe603GRuztjG). For more practice Qs, see Fiveable practice problems (https://library.fiveable.me/practice/ap-chemistry).
What's the difference between drawing a solution of salt water vs sugar water at the particle level?
Drawings should show different particles and interactions, not just dots. For salt water (NaCl in H2O) show separate Na+ and Cl− ions surrounded by hydration shells: water dipoles oriented with O toward Na+ and H toward Cl− (ion–dipole interactions). Include a lot of water molecules and fewer ions to reflect concentration. Indicate ionic dissociation (no intact NaCl formula units). For sugar water (sucrose or glucose, a nonelectrolyte) draw intact neutral solute molecules dispersed among water, with multiple hydrogen bonds between solute OH groups and water (no ions, no charge separation). Also show relative concentrations (more solvent, less solute). If concentrated, draw more solute particles; if dilute, mostly solvent. These particulate diagrams communicate structure and solute–solvent interactions—key for Topic 3.8 (represent interactions and concentrations). For a quick study review, see the Topic 3.8 study guide (https://library.fiveable.me/ap-chemistry/unit-3/representations-solutions/study-guide/O4uZStuqpe603GRuztjG). For broader review and practice, check Unit 3 (https://library.fiveable.me/ap-chemistry/unit-3) and extra problems (https://library.fiveable.me/practice/ap-chemistry).
How do you show which particles are solute vs solvent in a diagram?
Make solute and solvent visually different and show how they interact. - Use different shapes/colors/sizes: e.g., many small blue circles for solvent (like H2O) and fewer green spheres for solute particles. - Show concentration by number density: more solvent particles, fewer solute particles. - Draw solvation shells: surround each solute ion/molecule with solvent molecules oriented to show interactions (oxygen toward cations, hydrogens toward anions for water). Label the interaction (ion–dipole, hydrogen bonding, dispersion). - For ionic electrolytes, show dissociation into separate ions (Na+ and Cl–) spaced and solvated; if partially associated, show some ion pairs. - For nonpolar solutes in polar solvent, show poor mixing (solvent molecules not strongly oriented) or for miscible cases show uniform dispersion. AP tasks expect particulate diagrams that communicate relative concentration and solute–solvent interactions (CED 3.8.A). Practice sketching these using the Topic 3.8 study guide (https://library.fiveable.me/ap-chemistry/unit-3/representations-solutions/study-guide/O4uZStuqpe603GRuztjG) and try practice problems (https://library.fiveable.me/practice/ap-chemistry).
Can someone explain how to interpret those particle diagrams with dots and circles?
Think of those diagrams as tiny maps showing two things AP cares about: who’s present (concentration) and how they interact (solute–solvent forces). Usually: - Dots = solvent molecules (often many); circles/clusters = solute particles (molecules or ions). Relative numbers show dilute vs concentrated. - If you see single ions surrounded by solvent “dots” in an organized shell, that’s solvation/hydration (ion–dipole interactions for ionic solutes in water). - Polar solute molecules will be near polar solvent dots and may show hydrogen bonding (dashed lines or oriented dipoles). Nonpolar solutes appear isolated among solvent with weak dispersion contacts. - Electrolytes are drawn as separated ions; nonelectrolytes stay intact as molecules. Ion pairing or incomplete dissociation may be shown by nearby oppositely charged ions. - Labels or patterns can indicate saturated/unsaturated (extra solid present = saturated; all solute dispersed = unsaturated). AP tip: the CED expects you to use particulate models to represent concentrations and interactions (3.8.A). For extra practice and visuals see the Topic 3.8 study guide (https://library.fiveable.me/ap-chemistry/unit-3/representations-solutions/study-guide/O4uZStuqpe603GRuztjG) and more practice problems (https://library.fiveable.me/practice/ap-chemistry).
Why do some particle models show the solvent molecules surrounding the solute?
Because particulate (particle) models are meant to show not just how many particles are present but how they interact (CED 3.8.A.1). Solvent molecules are drawn surrounding a solute to show solvation/hydration: solvent molecules orient and stick to solute particles via specific intermolecular forces (ion–dipole for ions in water, hydrogen bonding for polar solutes, or dispersion forces for nonpolar solutes). That “shell” explains why ionic solids dissociate into solvated ions (electrolytes) and why some solutes stay as intact molecules (nonelectrolytes). Showing solvent around solute also communicates concentration and local structure—how crowded the solute is and which interactions dominate—which is exactly what AP particulate diagrams should do (3.8.A). For more on how to draw these models and practice, see the Topic 3.8 study guide (https://library.fiveable.me/ap-chemistry/unit-3/representations-solutions/study-guide/O4uZStuqpe603GRuztjG) and the Unit 3 overview (https://library.fiveable.me/ap-chemistry/unit-3). Want more practice? Try the AP Chem practice question bank (https://library.fiveable.me/practice/ap-chemistry).
How do I know if I'm drawing too many or too few particles to represent the right concentration?
Think of particulate diagrams as proportional pictures, not literal counts. The goal is to show correct relative concentration and interactions (ion dissociation, solvation/ hydration shells, ion–dipole, H-bonding) per CED 3.8.A.1. Quick rules: - Use a manageable total (10–50 solvent particles) so your drawing stays clear. - Keep solute:solvent ratios accurate. Example: to show 1.0 M vs 0.1 M, make the solute count 10× larger in the 1.0 M diagram while keeping solvent counts the same. If you draw 30 water molecules, show 3 solute particles for 0.1× and 30 for 1.0× (or scale similarly). - For electrolytes, draw separated ions with hydration shells (ion–dipole). For nonelectrolytes, draw intact molecules interacting by H-bonding or dispersion. - Avoid overcluttering: if you need many solvent molecules to make ratios obvious, use smaller symbols or a key (1 dot = 5 molecules). This matches the AP expectation that particulate models communicate relative concentrations and interactions (3.8.A). For more examples and practice, see the Topic 3.8 study guide (https://library.fiveable.me/ap-chemistry/unit-3/representations-solutions/study-guide/O4uZStuqpe603GRuztjG) and unit/practice questions (https://library.fiveable.me/ap-chemistry/unit-3, https://library.fiveable.me/practice/ap-chemistry).
What are the most important things to include when drawing a particulate representation of a solution?
When you draw a particulate (particle-level) picture of a solution for AP Chem, include three things: composition (relative amounts), identity (types of particles), and interactions. - Composition: show correct relative concentration—lots of solvent particles, fewer solute particles; label saturated/unsaturated if relevant. - Identity: draw ions or molecules with different shapes/symbols (Na+ vs Cl– vs H2O vs C6H6). For ionic solutes show dissociation (Na+ and Cl– separated) vs nonelectrolytes (intact molecules). - Interactions: show solvation/hydration shells and the forces—ion–dipole around ions, hydrogen bonds for H-bonding solutes, dipole–dipole or dispersion for nonpolar molecules, and possible ion pairing if concentration is high. Use spacing to imply attraction/repulsion. These are exactly what the CED expects: represent interactions and concentrations (3.8.A.1). Want practice? Check the Topic 3.8 study guide on Fiveable (https://library.fiveable.me/ap-chemistry/unit-3/representations-solutions/study-guide/O4uZStuqpe603GRuztjG) and try practice problems (https://library.fiveable.me/practice/ap-chemistry).