Introduction
International trade allows all countries around the world to expand their markets and makes goods and services available to their population that might not be available domestically. International trade increases the variety of goods and services available to the population while creating a sense of competition, which in turn lowers prices for consumers.
Public policy is just simply the laws and regulations that govern economic activity. There are many trade agreements in place to govern international trade, such as NAFTA (North American Free Trade Agreement) and ASEAN (Association of Southeast Asian Nations). For example, in the United States, our largest trading partners are China, Canada, and Mexico. We participate in international trade because it is cheaper for us to trade for the goods than to produce them domestically (i.e. shoes, clothing, electronics). This guide will explain two key policies: trade quotas and tariffs.

Quotas
A quota is a government-imposed limit on production levels. This means that it limits the amount of a particular good that can come into a country from somewhere else. Quotas are used as a trade barrier in an effort to protect the domestic industries that produce similar goods.
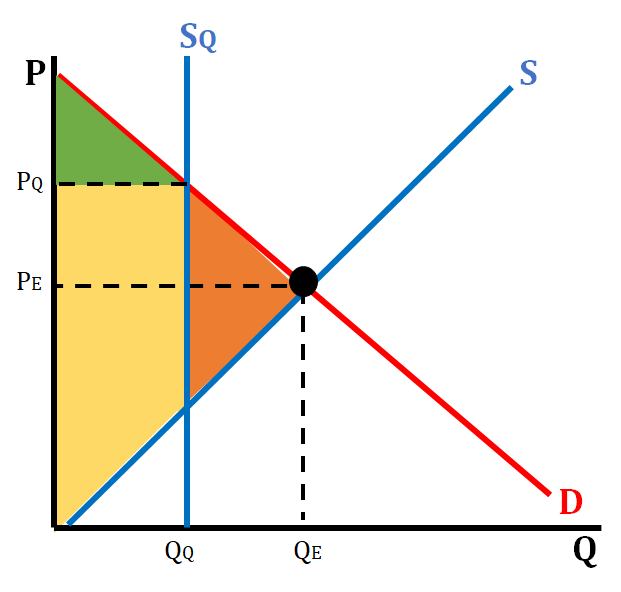
On the graph below, we see what a graph of a quota looks like. The green triangle is consumer surplus, the yellow shaded area is producer surplus and the orange triangle is deadweight loss. P_E and Q_E are the equilibrium price and quantity, respectively, before the quota. Q_Q is the quota limit on how much of the good can come into the country. P_Q is the price of the good when the quota is in effect. Sq is the imposed quota on a market. The government sets a perfectly inelastic Sq that determines exactly where the market functions.
Tariffs
Tariffs are simply a tax on a foreign good coming into a country. There are levied in an effort to reduce the amount of a particular good coming into a country by raising the price of the good.
The graphs that deal with tariffs and international trade are used to show what market price is before any international trade (closed borders), market price when there are no restrictions on trade (open borders), and market price when there are tariffs placed by the government to control the importation of certain goods and services.

The Graph Before a Tariff
Before trading, the market functions like normal, with the equilibrium price and quantity settling on QE and PE.
However, once we trade, the market changes. In the world, the price is Pw. However, this is NOT the same as a shortage! This is because all of our demand can actually be satisfied. How? Trade! The domestic market only produces Q1, but we can import Q4-Q1 to satisfy this market. At this state, consumer surplus is the monsterous triangle F-Pw-C, whereas producer surplus is the little triangle Pw-E-origin. Note that this market is entirely efficient! However, it's pretty bad for domestic producers. That's where a tariff comes in.
The Graph After a Tariff
As discussed, a tariff is a tax on a foreign good. Unlike an excise tax, a tariff simply increases what was before the world price. In the above graph, the price increases from Pw to Pt. This is still lower than the domestic price, but lesser so. Consumer surplus decreases since the price has increased, and producer surplus increases. However, there are a few more pieces. First, we see that our new quantity demanded is Q4 and our new quantity supplied is Q3. Thus, we must still import Q4 - Q3. This is taxed, so we have a rectangle of tax revenue as seen in the graph below. We also have lost consumer surplus. This is represented by the yellow triangles of deadweight loss. This is surplus that has been lost because of the tariff.
❓This graph uses some different notation. In this graph, DD and DS are short for "domestic demand" and "domestic supply". They just indicate that we're in a world economy but a domestic market!

Frequently Asked Questions
What is the difference between tariffs and quotas?
A tariff is a per-unit tax on imported goods; a quota is a legal limit on the quantity of imports. Both raise the domestic price above the world price, reduce imports, increase producer surplus, lower consumer surplus, and create deadweight loss (CED POL-1.B.1–B.3). Key differences: a tariff generates government revenue equal to the tax times imported units, while a quota creates “import-quota rents” (profits) that go to whoever holds the import rights (foreign exporters or domestic license holders). With a tariff you can calculate revenue easily from the tax and quantity; with a quota you must track who captures the rents. On the AP exam you should be ready to show these effects with supply/demand graphs (label world price, domestic price, import quantity) and calculate changes in surplus (free-response skill category 4; see Topic 2.9 study guide) (https://library.fiveable.me/ap-microeconomics/unit-2/international-trade-public-policy/study-guide/QO78r50TDqAhfQkGzcsV). For more unit review and practice problems, check Unit 2 (https://library.fiveable.me/ap-microeconomics/unit-2) and the 1000+ practice questions (https://library.fiveable.me/practice/ap-microeconomics).
How do I know if a country should import or export a good when they open to trade?
Look at the domestic (autarky) equilibrium price and compare it to the world price. Two rules: - If world price > domestic (autarky) price → your country will export. Domestic producers can get the higher world price, so at that price domestic quantity supplied > domestic quantity demanded and the excess is exported. Producers gain, consumers lose a bit; total surplus usually rises (show on supply/demand graph). - If world price < domestic price → your country will import. At the lower world price domestic quantity demanded > domestic quantity supplied and the gap is filled by imports. Consumers gain, producers lose; total surplus usually rises. For AP free-response, be ready to draw the domestic supply and demand, add a horizontal world price line, show import/export quantity (difference between Qd and Qs), and label changes in consumer/producer surplus and deadweight loss (CED POL-1.B.1). For a quick refresher, see the Topic 2.9 study guide (https://library.fiveable.me/ap-microeconomics/unit-2/international-trade-public-policy/study-guide/QO78r50TDqAhfQkGzcsV), the Unit 2 overview (https://library.fiveable.me/ap-microeconomics/unit-2), and practice problems (https://library.fiveable.me/practice/ap-microeconomics).
What happens to consumer surplus and producer surplus when a country opens to international trade?
If a country opens to trade, compare the world price to the autarky (no-trade) domestic price: - If world price is lower than autarky price (country imports): domestic price falls to world price. Consumer surplus increases (buyers pay less), producer surplus decreases (domestic firms receive a lower price). Total surplus rises overall because consumers gain more than producers lose—the gap is filled by imports. The net gain appears as two “gains from trade” triangles on the graph (no government revenue if trade is free). - If world price is higher (country exports): domestic price rises. Producer surplus increases, consumer surplus falls. Total surplus still rises overall because exporters capture gains from trade. Remember: tariffs or quotas reduce some of those gains (tariffs create government revenue but also deadweight loss; quotas can create quota rents), so total surplus falls relative to free trade. AP exam tasks often ask you to show these changes on supply/demand graphs, so practice drawing them (see the Topic 2.9 study guide: https://library.fiveable.me/ap-microeconomics/unit-2/international-trade-public-policy/study-guide/QO78r50TDqAhfQkGzcsV). For extra practice, check more problems at (https://library.fiveable.me/practice/ap-microeconomics).
I'm confused about autarky - what does this mean and how is it different from free trade?
Autarky means a country is closed to international trade—it must consume what it produces. Under autarky the domestic equilibrium price and quantity are set by the country’s own supply and demand. Free trade means the country can buy/sell at the world price; if world price is lower than autarky price the country imports, if higher it exports. Graphically (AP free-response stuff): compare the autarky equilibrium to the world price line. If world price < autarky price → domestic price falls to world price, consumer surplus rises, producer surplus falls, and net total surplus typically rises (gains from trade). If world price > autarky price → price rises, producers gain, consumers lose, country exports. Tariffs/quotas then change these outcomes (consumer/producer surplus, deadweight loss, government revenue or quota rents)—exactly what Topic 2.9 asks you to analyze. Review examples and practice drawing these graphs in the Topic 2.9 study guide (https://library.fiveable.me/ap-microeconomics/unit-2/international-trade-public-policy/study-guide/QO78r50TDqAhfQkGzcsV). For more review across Unit 2 see (https://library.fiveable.me/ap-microeconomics/unit-2) and try practice problems (https://library.fiveable.me/practice/ap-microeconomics).
How do I calculate the deadweight loss from a tariff using a graph?
Draw a supply–demand graph with price on the vertical axis and quantity on the horizontal. Start at free trade: label the world price (Pw), find domestic quantity supplied (Qs_free) and demanded (Qd_free), and mark imports M0 = Qd_free − Qs_free. Now add the tariff: the domestic price rises to Ptariff = Pw + tariff. Find new Qs_tariff and Qd_tariff, and new imports M1 = Qd_tariff − Qs_tariff. To get deadweight loss (DWL) from the tariff: 1. Identify the two small triangles lost to efficiency: - Triangle A (production distortion): between domestic supply and Pw on the interval from Qs_free to Qs_tariff. - Triangle B (consumption distortion): between domestic demand and Pw on the interval from Qd_tariff to Qd_free. 2. Calculate each triangle’s area with 1/2 * base * height: - height = tariff (Ptariff − Pw) - base for Triangle A = Qs_tariff − Qs_free - base for Triangle B = Qd_free − Qd_tariff 3. DWL = area(Triangle A) + area(Triangle B) = 1/2*(tariff)*(Qs_tariff − Qs_free) + 1/2*(tariff)*(Qd_free − Qd_tariff). On the AP exam you must draw and label the graph and show these calculations (CED POL-1.B.2: use graphs and calculate changes). For more worked examples and practice, see the Topic 2.9 study guide (https://library.fiveable.me/ap-microeconomics/unit-2/international-trade-public-policy/study-guide/QO78r50TDqAhfQkGzcsV) and try problems at (https://library.fiveable.me/practice/ap-microeconomics).
Why do tariffs increase government revenue but quotas don't?
A tariff is a per-unit tax on imports, so every unit imported has a dollar amount paid to the government. On a supply/demand graph (what the CED expects you to draw on free-response), the tariff raises domestic price above the world price and reduces imports; government revenue equals the tariff size times the new import quantity (a rectangle on the graph). A quota is a legal limit on the quantity imported. It raises domestic price too, but it doesn’t automatically send money to the government. The extra value (import quota rents) goes to whoever controls the right to import—foreign exporters, domestic importers, or whoever holds licenses—unless the government auctions those licenses and collects that rent. Remember to show the tariff revenue rectangle vs. the quota’s rent when you draw graphs for AP FRQs (see Topic 2.9 study guide for examples) (https://library.fiveable.me/ap-microeconomics/unit-2/international-trade-public-policy/study-guide/QO78r50TDqAhfQkGzcsV). For more practice, check the unit page (https://library.fiveable.me/ap-microeconomics/unit-2) and thousands of practice problems (https://library.fiveable.me/practice/ap-microeconomics).
What's the difference between domestic price and world price in international trade graphs?
Domestic price = the equilibrium price that clears your home market when it's closed to trade (autarky). World price = the price at which the good trades internationally—shown as a horizontal line on AP trade graphs because a small country is a price taker. If world price is lower than the domestic price, consumers buy more and the country imports the difference (consumer surplus rises, producer surplus falls). If world price is higher, domestic producers export the gap (producer surplus rises, consumer surplus falls). On AP free-response you’ll draw the domestic supply and demand, mark autarky P and Q, then add the horizontal world price and show imports/exports as the horizontal distance between domestic Qs (use CED learning objective POL-1.B). For practice drawing and calculations, see the Topic 2.9 study guide (https://library.fiveable.me/ap-microeconomics/unit-2/international-trade-public-policy/study-guide/QO78r50TDqAhfQkGzcsV) and extra problems (https://library.fiveable.me/practice/ap-microeconomics).
How do I draw the supply and demand graph when a country opens to trade?
Start with the autarky graph: draw downward-sloping demand and upward-sloping supply, label autarky price P_a and quantity Q_a at their intersection. AP FRQs often require this (Skill 4—draw and label). Then add trade: draw a horizontal world price line P_w. Two cases: - If P_w < P_a (cheaper world price) the country imports. At P_w, quantity demanded Q_d is where demand meets P_w and quantity supplied Q_s is where supply meets P_w. Imports = Q_d − Q_s. Consumer surplus rises, producer surplus falls, total surplus increases (gains from trade). Shade CS and PS areas and label import quantity. - If P_w > P_a the country exports. At P_w, Q_s > Q_d; exports = Q_s − Q_d. Producers gain, consumers lose, total surplus increases. On the AP exam, be sure to label axes, curves, P_a, P_w, Q_a, Q_d, Q_s, and show changes in consumer/producer surplus and import/export quantity (CED POL-1.B.1, Skill 4). For practice, see the topic study guide (https://library.fiveable.me/ap-microeconomics/unit-2/international-trade-public-policy/study-guide/QO78r50TDqAhfQkGzcsV), unit review (https://library.fiveable.me/ap-microeconomics/unit-2), and extra practice problems (https://library.fiveable.me/practice/ap-microeconomics).
I don't understand why opening to trade sometimes helps consumers but hurts producers - can someone explain?
If your country opens to trade and the world price is lower than the autarky (no-trade) price, consumers win and producers lose—here’s why in AP terms. At the lower world price, domestic price falls to PW, so quantity demanded rises and quantity supplied falls; the gap is filled by imports. Consumer surplus rises because buyers pay less and more units are consumed. Producer surplus falls because domestic firms get a lower price and produce less. Total surplus usually rises (gains from trade) because resources shift to whatever you have comparative advantage in, though some domestic producers are worse off. On the AP exam you should show this with a supply-demand graph: label autarky price, world price, consumer/producer surplus changes, and imports (CED POL-1.B). Practice drawing and calculating these areas using the Topic 2.9 study guide (https://library.fiveable.me/ap-microeconomics/unit-2/international-trade-public-policy/study-guide/QO78r50TDqAhfQkGzcsV) and try problems at (https://library.fiveable.me/practice/ap-microeconomics).
How do tariffs affect the quantity imported and domestic production?
A tariff is a tax on imports. With free trade, domestic price = world price and imports = (domestic demand − domestic supply). A tariff raises the domestic price above the world price by the amount of the tariff, so domestic quantity demanded falls and domestic quantity supplied rises. The gap filled by imports shrinks—imports decrease. On a supply/demand graph: domestic supply shifts (price received by foreign sellers falls), domestic producers expand output, consumers buy less. Consumer surplus falls, producer surplus rises, the government collects tariff revenue, and two deadweight-loss triangles appear (lost gains from trade). You should be able to show these changes and calculate new quantities, tariff revenue, and deadweight loss on exam (CED POL-1.B.2). Review the Topic 2.9 study guide (https://library.fiveable.me/ap-microeconomics/unit-2/international-trade-public-policy/study-guide/QO78r50TDqAhfQkGzcsV), Unit 2 overview (https://library.fiveable.me/ap-microeconomics/unit-2), and practice more problems (https://library.fiveable.me/practice/ap-microeconomics).
What happens to total economic surplus when quotas are imposed?
A quota lowers total economic surplus compared with free trade. By restricting imports, the domestic price rises above the world price, so consumer surplus falls and producer surplus rises—but the loss to consumers is larger than the gain to producers. The difference shows up as deadweight loss (two triangular areas of lost gains from trade). Some surplus may be captured as “quota rents” by foreign exporters or by domestic holders of import licenses, but those rents don’t recover the full efficiency loss. On AP questions you should show this with a supply–demand graph (world price line, smaller import wedge), label changes in consumer/producer surplus, import quota rents, and calculate deadweight loss (POL-1.B.1–3). For practice drawing and calculations, see the Topic 2.9 study guide (https://library.fiveable.me/ap-microeconomics/unit-2/international-trade-public-policy/study-guide/QO78r50TDqAhfQkGzcsV) and more problems at the Unit 2 page (https://library.fiveable.me/ap-microeconomics/unit-2) or the practice bank (https://library.fiveable.me/practice/ap-microeconomics).
Why would a government choose a quota instead of a tariff if both restrict trade?
A government might pick a quota instead of a tariff because a quota gives precise control over the quantity of imports while a tariff only makes imports more expensive. With a quota you know exactly how much foreign supply is limited, so domestic quantity supplied rises and domestic price increases by a predictable amount—useful if the goal is to protect domestic producers. Quotas also create “import quota rents” (extra profits captured by whoever holds the import licenses), whereas tariffs generate government revenue. Politically, quotas can be easier to sell to producers because they guarantee reduced competition; politically powerful firms or countries can get quota licenses. For AP exam work, remember to show these effects with supply/demand graphs and calculate changes in consumer surplus, producer surplus, deadweight loss, and where rents go (CED POL-1.B.2–.3). For a short review, see the Topic 2.9 study guide (https://library.fiveable.me/ap-microeconomics/unit-2/international-trade-public-policy/study-guide/QO78r50TDqAhfQkGzcsV) and practice problems (https://library.fiveable.me/practice/ap-microeconomics).
How do I calculate the change in consumer surplus when a tariff is removed?
When a tariff is removed, consumer surplus changes equal the area between the old (with tariff) price and the new (world) price under the demand curve. If the tariff lowers price from P_t to P_w and quantity rises from Q1 (at P_t) to Q2 (at P_w), compute the trapezoid area: ΔCS = (P_t − P_w) * (Q1 + Q2) / 2 Steps: 1. From the graph/table, read P_t, P_w, Q1, Q2. 2. Plug into the formula above. If P_w < P_t the result is positive (consumers gain); if P_w > P_t (rare), it’s negative. 3. If demand isn’t linear and you only have discrete data, approximate by summing rectangles/triangles between price steps or use integrals for continuous demand. This is exactly the sort of numerical analysis AP free-response items ask for (Skill 3.C, POL-1.B). For worked examples and practice, check the Topic 2.9 study guide (https://library.fiveable.me/ap-microeconomics/unit-2/international-trade-public-policy/study-guide/QO78r50TDqAhfQkGzcsV) and more practice problems (https://library.fiveable.me/practice/ap-microeconomics).
What are the real-world effects of trade wars like the one between US and China?
Trade wars (like US–China) act like big, economy-wide tariffs/quotas. In AP terms: they raise the domestic price above the world price, reduce imports, increase producer surplus for protected firms, reduce consumer surplus, create deadweight loss, and generate some government tariff revenue. Real-world consequences: higher consumer prices, disrupted supply chains (higher input costs for firms), lost export markets from retaliation (hurting some domestic industries), shifting jobs toward protected sectors but overall lower total economic surplus, and increased uncertainty that reduces investment. On the exam you should be able to show this on supply/demand graphs (world price, domestic price with tariff, import wedge) and calculate changes in consumer/producer surplus, tariff revenue, and deadweight loss (CED POL-1.B, POL-1.B.2). For a quick review, see the Topic 2.9 study guide (https://library.fiveable.me/ap-microeconomics/unit-2/international-trade-public-policy/study-guide/QO78r50TDqAhfQkGzcsV) and Unit 2 overview (https://library.fiveable.me/ap-microeconomics/unit-2). Practice problems are at (https://library.fiveable.me/practice/ap-microeconomics).
I'm confused about when domestic supply meets world price vs domestic demand - help?
Think of the world price line as a horizontal price you can “plug into” your domestic supply and demand curves. - If world price < autarky (no-trade) price: domestic firms won’t supply as much at that lower price. Find where the horizontal world-price line crosses the domestic supply curve = domestic quantity supplied. Where it crosses domestic demand = domestic quantity demanded. Because demand > supply at that price, the gap (Qd − Qs) = imports. Consumers gain, producers lose (see POL-1.B.1). - If world price > autarky price: domestic firms supply more than consumers buy at that higher price. Qs (at world price) − Qd (at world price) = exports. Producers gain, consumers lose. For the AP exam you should draw the horizontal world-price line on a supply/demand graph, label Qs and Qd at that price, and compute imports/exports and surplus changes (POL-1.B). Practice with the Topic 2.9 study guide (https://library.fiveable.me/ap-microeconomics/unit-2/international-trade-public-policy/study-guide/QO78r50TDqAhfQkGzcsV) and more problems at (https://library.fiveable.me/practice/ap-microeconomics).