Long-Run Aggregate Supply (LRAS)
Long-run aggregate supply is defined as the number of goods and services that an economy is capable of producing with the full employment of resources.
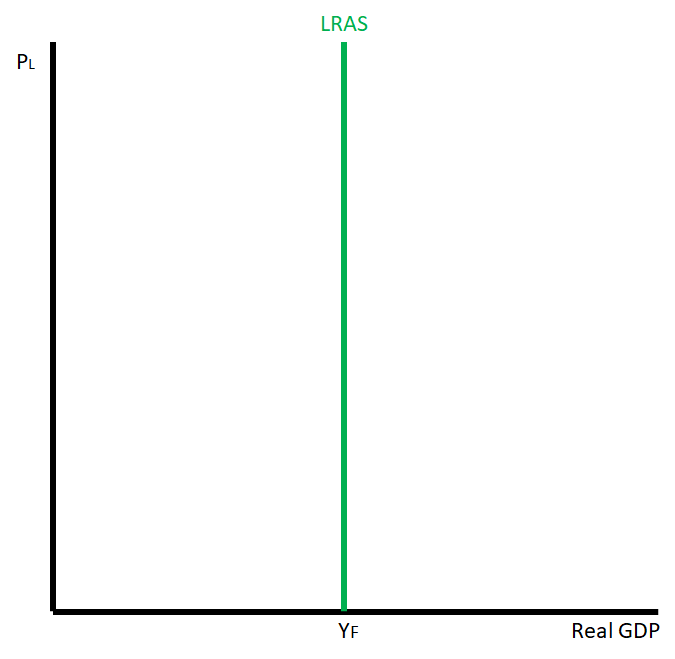
The relationship between the price level and Real GDP output supplied in the long-run is constant. As the price level rises or falls, firms will not alter the quantity of Real GDP output they produce.
In the long run, wages and resources prices are flexible. When price level increases, wages will increase by the same amount.
The long-run aggregate supply curve (LRAS) is vertical at full-employment. YF represents the quantity of output the society can produce when they are at full employment and at the natural rate of unemployment. The LRAS curve shifting to the right can correspond with the production possibility curve (PPC) because both of them represent production capacity. It can also refer to economic growth. Whenever LRAS shifting to the right is mentioned, you can automatically pair that with the PPC expanding outward and economic growth.
The LRAS shifts anytime a situation would cause the production possibilities curve to shift. The difference between a change in the SRAS and LRAS is that we are looking at changing the potential output of an economy with LRAS and not the actual output at the time, as we do with SRAS. The shifting of the LRAS happens when there is a change in:
- the number of resources (factors of production such as larger labor force 🦾, more capital 💻, more natural resources🌼)
- the quality of resources (factors of production such as better technology that increases productivity of labor 🦾 and capital 💻)
- policy (incentives or policies that works to increase employment)
Any of these factors can cause an increase in the potential output of an economy, which will shift the LRAS to the right, or a decrease in the potential output of an economy, which will shift the LRAS to the left.
If the LRAS Curve shifts left, an economy's capacity to produce decreases.

Shifters in LRAS
A change in the number of resources that could impact the LRAS includes a change in:
- the size of the workforce
- the number of land resources available
- capital stock
Some examples or scenarios in this category that could increase the LRAS include:
- a larger workforce, an increase in land resources
- an increase in capital stock
- a decrease in the size of the workforce or population
- depletion of land resources
- destruction of capital
A change in the quality of resources that could impact the LRAS includes:
- a better educated and more highly skilled workforce
- an improvement in the quality of land resources
- an improvement in the capital
When we see greater investment in schools and job training facilities, it allows us to have a workforce with more productive skills. When new technology is developed that makes certain resources more productive, we are able to increase our potential output.
Examples of this could include better ways to access our resources, such as items like fertilizer and chemical pesticides that lead to a greater yield of certain goods. When we develop technology to improve our capital resources than we also see an increase in LRAS. If the deterioration of a country's infrastructure or its educational system occurs, that can cause a decrease in potential output for the economy.
Also, when there are policy changes within an economy, we can change our potential output. A lot of times these policies are created within the different levels of government. For example, if the government enacts policies that provide large incentives to find a job, then we see an increase in the size of our workforce which in turn increases our LRAS. Another example could be the government giving tax incentives to invest in capital or technology, which also causes our potential output to increase.
Frequently Asked Questions
What is the long-run aggregate supply curve and why is it vertical?
The long-run aggregate supply (LRAS) curve shows the economy’s maximum sustainable output—potential (full-employment) GDP, often labeled YF—when all resources are fully employed. It’s vertical because in the long run wages and other input prices are fully flexible (EK MOD-2.E.1), so changes in the price level don’t change real output; they only change nominal wages and prices. That’s why there’s no long-run trade-off between inflation and unemployment. LRAS corresponds to the production possibilities curve (EK MOD-2.F.1): both represent the economy’s capacity. LRAS shifts only when supply-side factors change (labor force, capital stock, productivity, technology), not because of short-run demand or price-level moves (EK MOD-2.F.2). On the AP exam you should draw LRAS as a vertical line at YF on AD-SRAS graphs. For a quick refresher, see the Topic 3.4 study guide (https://library.fiveable.me/ap-macroeconomics/unit-3/long-run-aggregate-supply-lras/study-guide/ryR454U7pI6tFIKsreOV) and practice questions (https://library.fiveable.me/practice/ap-macroeconomics).
How do I know the difference between short run and long run in economics?
Short run vs. long run: the short run is when some input prices (especially nominal wages) are sticky/fixed, so output can deviate from full-employment (SRAS slopes upward). The long run is when wages and all prices are fully flexible, so the economy produces at its potential (full-employment) output and LRAS is vertical at that level—no long-run tradeoff between inflation and unemployment (monetary neutrality). Practically: if a demand shock raises the price level, output can rise in the short run (because wages haven’t adjusted); in the long run wages rise, SRAS shifts, and output returns to potential while the price level changes. On the AP exam you’ll often need to draw AD, SRAS, and vertical LRAS and explain short-run vs long-run adjustments (Skill 4: graphing + Skill 3: interpretation). For a concise CED-aligned review, see the Topic 3.4 study guide (https://library.fiveable.me/ap-macroeconomics/unit-3/long-run-aggregate-supply-lras/study-guide/ryR454U7pI6tFIKsreOV) and try practice problems (https://library.fiveable.me/practice/ap-macroeconomics).
Why does the LRAS curve look like a straight vertical line on the graph?
The LRAS is vertical because in the long run all prices and wages are fully flexible, so the economy’s output isn’t determined by the price level—it’s determined by real supply-side factors (labor, capital, technology). That fixed long-run output is called potential or full-employment GDP (the natural rate of unemployment). So on an AD-AS graph you draw LRAS as a vertical line at YF to show maximum sustainable capacity; changes in the price level only move you along LRAS, they don’t change YF. This matches the CED: LRAS corresponds to the PPC (both show maximum sustainable production), and there’s no long-run inflation/unemployment trade-off (monetary neutrality). For practice drawing and exam-style questions that use this idea, check the Topic 3.4 study guide (https://library.fiveable.me/ap-macroeconomics/unit-3/long-run-aggregate-supply-lras/study-guide/ryR454U7pI6tFIKsreOV) or the Unit 3 overview (https://library.fiveable.me/ap-macroeconomics/unit-3).
What's the connection between LRAS and the production possibilities curve - are they the same thing?
Short answer: they’re not identical graphs, but they represent the same economic idea—maximum sustainable capacity. Why: the production possibilities curve (PPC) shows the maximum combinations of two goods an economy can produce with full employment of resources. The LRAS curve shows the economy’s total maximum (potential) real GDP—the same “full-employment” output—at different price levels. Because potential output doesn’t depend on the price level in the long run, LRAS is vertical at that full-employment (natural) level of output (CED EK MOD-2.F.1–2.F.2). Practical tip for the exam: you might be asked to draw LRAS as a vertical line and label full-employment output (e.g., on a free-response AD-AS graph). An increase in resources or technology shifts both the PPC outward and LRAS rightward (both show greater sustainable capacity). For a quick review, see the Topic 3.4 study guide (https://library.fiveable.me/ap-macroeconomics/unit-3/long-run-aggregate-supply-lras/study-guide/ryR454U7pI6tFIKsreOV) and more Unit 3 resources (https://library.fiveable.me/ap-macroeconomics/unit-3). Practice problems are at (https://library.fiveable.me/practice/ap-macroeconomics).
I don't understand why wages and prices are flexible in the long run but not the short run - can someone explain?
Short run vs. long run comes down to “nominal rigidities.” In the short run wages and some prices are sticky because of contracts, menu costs, and slow changes in expectations (firms and workers don’t instantly renegotiate wages or prices). That means output can move away from potential when AD shifts. In the long run those nominal rigidities have time to adjust: wage contracts expire, firms change prices, and inflation expectations update—so wages and input prices become fully flexible. With fully flexible wages/prices the LRAS is vertical at full-employment (potential GDP), so policy can’t permanently trade inflation for lower unemployment. On the AP exam you should be able to show this on AD–SRAS–LRAS graphs and explain the adjustment to full employment (see Topic 3.4 in the CED). For a clear review and practice, check the LRAS study guide (https://library.fiveable.me/ap-macroeconomics/unit-3/long-run-aggregate-supply-lras/study-guide/ryR454U7pI6tFIKsreOV), the Unit 3 overview (https://library.fiveable.me/ap-macroeconomics/unit-3), and practice problems (https://library.fiveable.me/practice/ap-macroeconomics).
How do I shift the LRAS curve left or right and what causes those shifts?
LRAS is vertical at full-employment (potential) output because wages and prices are fully flexible in the long run (CED EK MOD-2.F.2). It shifts only when an economy’s maximum sustainable capacity changes—think of the PPC moving. Shift LRAS right (increase potential output) when: - Labor supply or quality rises (more workers or better skills) - Capital stock grows (more machines/infrastructure) - Technology improves (higher productivity) - More natural resources or better institutions/policies that raise productivity Shift LRAS left (decrease potential output) when: - Natural disasters or wars destroy capital/labor - A decline in labor supply or productivity - Deterioration in institutions or property rights On the exam you should draw LRAS as a vertical line at Yf and explain the supply-side cause (CED EK MOD-2.F.1). For a deeper review and practice problems, see the Topic 3.4 study guide (https://library.fiveable.me/ap-macroeconomics/unit-3/long-run-aggregate-supply-lras/study-guide/ryR454U7pI6tFIKsreOV), Unit 3 overview (https://library.fiveable.me/ap-macroeconomics/unit-3) and practice questions (https://library.fiveable.me/practice/ap-macroeconomics).
What does full employment level of output mean and how do I find it on a graph?
Full-employment level of output (aka potential GDP or full-employment output) is the maximum sustainable real GDP an economy can produce when labor and other resources are fully employed—unemployment is at the natural rate, not zero. On an AD-AS graph you find it as the vertical LRAS curve: the LRAS is vertical at YF because wages and prices fully adjust in the long run (EK MOD-2.F.1–F.2). So to show it: draw AD and SRAS, then draw a vertical LRAS and label its x-coordinate YF (the CED and FRQs expect LRAS vertical and YF labeled). If equilibrium (AD ∩ SRAS) is left of YF you have a recessionary gap; if right, an inflationary gap. For practice drawing and FRQ prep see the Topic 3.4 study guide (https://library.fiveable.me/ap-macroeconomics/unit-3/long-run-aggregate-supply-lras/study-guide/ryR454U7pI6tFIKsreOV) and extra problems (https://library.fiveable.me/practice/ap-macroeconomics).
Is there really no trade-off between inflation and unemployment in the long run?
Short answer: yes—in the long run there’s essentially no trade-off between inflation and unemployment. Why: the CED says that in the long run wages and prices are fully flexible, so the LRAS is vertical at full-employment (potential) output. Any attempt to keep unemployment below the natural rate by raising AD only raises the price level (inflation) once wages adjust; unemployment returns to the natural rate. That’s why the long-run Phillips curve (LRPC) is vertical. In contrast, the short run can show a trade-off (downward SRPC) because some wages/prices are sticky. For the exam: be ready to draw AD, SRAS, and vertical LRAS and explain long-run wage/price adjustments (CED EK MOD-2.E.1, EK MOD-2.F.2). Review the Topic 3.4 study guide (https://library.fiveable.me/ap-macroeconomics/unit-3/long-run-aggregate-supply-lras/study-guide/ryR454U7pI6tFIKsreOV) and practice problems (https://library.fiveable.me/practice/ap-macroeconomics) for AD-AS and Phillips curve questions.
What's maximum sustainable capacity and how is it different from just maximum output?
Maximum sustainable capacity = the economy’s potential output (full-employment output)—the total real GDP it can produce over a period if all resources are fully employed without pushing up inflation. It’s what the LRAS/production possibilities curve represents: output consistent with the natural rate of unemployment and normal utilization of capital and labor. “Maximum output” sounds like the absolute highest short-term level you could produce (e.g., by running factories extra shifts, overtime, or depleting inventories). That might exceed potential for a while but isn’t sustainable—it raises costs, causes inflation, or wears out capital. LRAS is vertical at potential output because wages and prices fully adjust in the long run (no long-run tradeoff between inflation and unemployment). On the AP exam you should be able to draw LRAS as a vertical line at full-employment output and explain supply-side factors (productivity, capital, tech). For a quick review, see the Topic 3.4 study guide (https://library.fiveable.me/ap-macroeconomics/unit-3/long-run-aggregate-supply-lras/study-guide/ryR454U7pI6tFIKsreOV) and practice problems (https://library.fiveable.me/practice/ap-macroeconomics).
When the economy is at full employment does that mean unemployment is zero?
No—full employment doesn’t mean zero unemployment. On the AP, “full-employment output” or potential GDP corresponds to the LRAS vertical line: it’s the maximum sustainable output when wages and prices fully adjust (EK MOD-2.F.1–2). But even at full employment there’s a natural rate of unemployment made up of frictional and structural unemployment (people between jobs or mismatched skills). Cyclical unemployment (from recessions) is zero at full employment, but the natural rate remains positive. That’s why there’s no long-run trade-off between inflation and unemployment: the long-run Phillips curve is vertical at the natural rate (EK MOD-2.E.1). For review, see the LRAS study guide (https://library.fiveable.me/ap-macroeconomics/unit-3/long-run-aggregate-supply-lras/study-guide/ryR454U7pI6tFIKsreOV) and Unit 3 overview (https://library.fiveable.me/ap-macroeconomics/unit-3). Practice more AD-AS and Phillips curve problems at (https://library.fiveable.me/practice/ap-macroeconomics).
How do I draw the LRAS curve correctly on an AD-AS graph?
Draw the LRAS as a vertical line at the economy’s full-employment (potential) output, Yf—because in the long run wages and prices are fully flexible so price level doesn’t change real output (EK MOD-2.F.2). On your AD-AS graph: label the vertical axis “Price Level,” horizontal “Real GDP (Output).” Plot AD (downward sloping), SRAS (upward sloping) and LRAS (vertical) and mark the intersection of AD and SRAS as the short-run equilibrium (Y1, PL1) and the LRAS intersection as Yf. For free-response, the College Board expects correctly labeled curves and Yf shown (Skill 4—draw a correctly labeled graph). If LRAS shifts, show it moving right for gains in productivity, capital, or labor (EK MOD-2.F.1). For more examples and practice drawing AD/SRAS/LRAS and FRQ tips, see the Topic 3.4 study guide (https://library.fiveable.me/ap-macroeconomics/unit-3/long-run-aggregate-supply-lras/study-guide/ryR454U7pI6tFIKsreOV) and Unit 3 overview (https://library.fiveable.me/ap-macroeconomics/unit-3). Need practice? Try problems at (https://library.fiveable.me/practice/ap-macroeconomics).
What happens to LRAS during a recession or economic growth?
In the long run LRAS doesn’t move just because the economy is in a recession or a short-run boom—LRAS is vertical at full-employment (potential) output, YF, because wages and prices are fully flexible (CED EK MOD-2.F.2, EK MOD-2.E.1). - During a recession the actual output (Y) falls below YF (a recessionary gap). LRAS stays put; over time wages and input prices fall, SRAS shifts right, and the economy returns to LRAS. There’s no long-run trade-off between inflation and unemployment. - During sustained economic growth (more labor, higher capital stock, better technology or productivity), LRAS shifts right (outward)—like an outward shift of the PPC—raising potential GDP (CED EK MOD-2.F.1; keywords: capital stock, labor productivity, technology). For AP prep, remember to draw LRAS as a vertical line at YF on AD-SRAS-LRAS graphs (see the Topic 3.4 study guide: https://library.fiveable.me/ap-macroeconomics/unit-3/long-run-aggregate-supply-lras/study-guide/ryR454U7pI6tFIKsreOV). More practice problems are at (https://library.fiveable.me/practice/ap-macroeconomics).
Why can't the economy produce beyond the LRAS curve even if demand increases?
Because the LRAS is vertical at full-employment (potential) output, it shows the economy’s maximum sustainable capacity—the most output you can get when labor, capital, and technology are fully used. If aggregate demand rises when you’re already at LRAS, firms can’t keep increasing real output long-term because all resources are already employed. Instead, higher AD just pushes up the price level (inflation); real output doesn’t rise in the long run because wages and input prices fully adjust (wage-price flexibility and monetary neutrality). To get output beyond LRAS you need real supply-side changes (more labor, capital, productivity, or tech), which shift LRAS right. For AP review, remember to show a vertical LRAS on AD-AS graphs and note that only supply-side factors move LRAS (see the Topic 3.4 study guide) (https://library.fiveable.me/ap-macroeconomics/unit-3/long-run-aggregate-supply-lras/study-guide/ryR454U7pI6tFIKsreOV). For practice problems, try the AP Macro practice bank (https://library.fiveable.me/practice/ap-macroeconomics).
I'm confused about when to use LRAS vs SRAS - which one do I use for different scenarios?
Use SRAS when you’re analyzing short-run changes in output and the price level—think sticky wages/prices and temporary gaps. SRAS is upward sloping: a shift in AD (or a short-run supply shock) changes real GDP and the price level. Use it to show cyclical unemployment, short-run policy effects, and the path back to full employment. Use LRAS when you’re talking about the economy’s potential (full-employment) output or long-run effects. LRAS is vertical at potential GDP because wages and prices are fully flexible (CED EK MOD-2.E.1, EK MOD-2.F.2). LRAS shifts only for supply-side changes: labor, capital, technology, productivity (EK MOD-2.F.1). Also use LRAS to show monetary neutrality in the long run—changes in AD affect only the price level, not real output. On the AP exam you’ll often draw AD, SRAS, and LRAS together and show short-run vs long-run adjustments (e.g., SRAS shifting back to LRAS). For more review see the Topic 3.4 study guide (https://library.fiveable.me/ap-macroeconomics/unit-3/long-run-aggregate-supply-lras/study-guide/ryR454U7pI6tFIKsreOV), the Unit 3 overview (https://library.fiveable.me/ap-macroeconomics/unit-3), and practice problems (https://library.fiveable.me/practice/ap-macroeconomics).
How does technology or population growth affect the long-run aggregate supply curve?
Technology improvements and population growth both shift the LRAS curve to the right (outward). LRAS is vertical at full-employment/potential output because wages and prices are fully flexible in the long run, so changes in technology or resources change the economy’s capacity, not the price level. Better technology raises labor productivity and effective capital, so the economy can sustainably produce more output. Population growth (or a larger labor force) increases the available labor input, also raising potential GDP. Graphically, the vertical LRAS moves right to a higher YF (like an outward shift of the PPC). This is a supply-side change—it increases potential output and reduces long-run constraints on growth. For more AP-aligned review, see the Topic 3.4 study guide (https://library.fiveable.me/ap-macroeconomics/unit-3/long-run-aggregate-supply-lras/study-guide/ryR454U7pI6tFIKsreOV) and practice problems (https://library.fiveable.me/practice/ap-macroeconomics).