Supply is the different quantities of goods and services that firms are willing and able to produce at various price levels. Understanding the relationship between supply and demand is crucial to determine the equilirium price.
Quantity Supplied vs. Supply
Quantity supplied is the amount of a good or service that is produced at a particular price level.
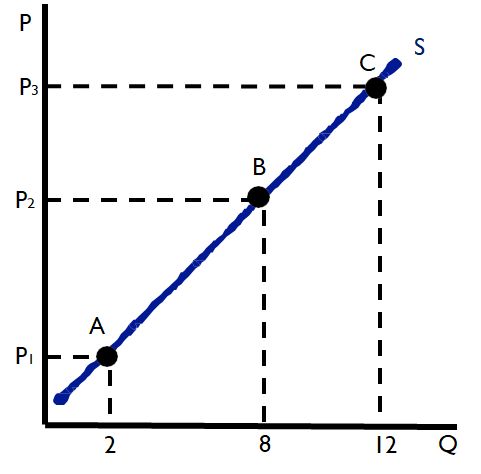
Below is a supply curve. Quantity supplied is one point on the curve (i.e. A, B, or C), and supply is the entire line, including all of the points that create it.

Law of Supply
The law of supply states that the relationship between the price level and the quantity demanded of a good or service is direct, or positive. As the price level rises, firms are more willing or more able to produce a greater quantity, and, therefore, produce more. As the price level falls, firms are less willing or less able to produce the same quantity, and, therefore, produce less.
In summary:
- When price level increases, the quantity of a good supplied increases.
- When price level decreases, the quantity of a good supplied decreases.
Using the chart above, when the price rises from P1 to P2, the quantity supplied increases from 2 units to 8 units. When the price drops from P3 to P2, the quantity supplied decreases from 12 units to 8 units.
💡The only thing that changes quantity supplied is the price of the good or service.
Let's take a look at another graph:
In the graph above, it is possible to observe that point 🅰️ has a price of $100 and a quantity supplied of 50.
When the price increases from $100 to $110 at point 🅱️ the quantity supplied also increases to 90. This exemplified the positive relationship between supply and price.
Determinants of Supply
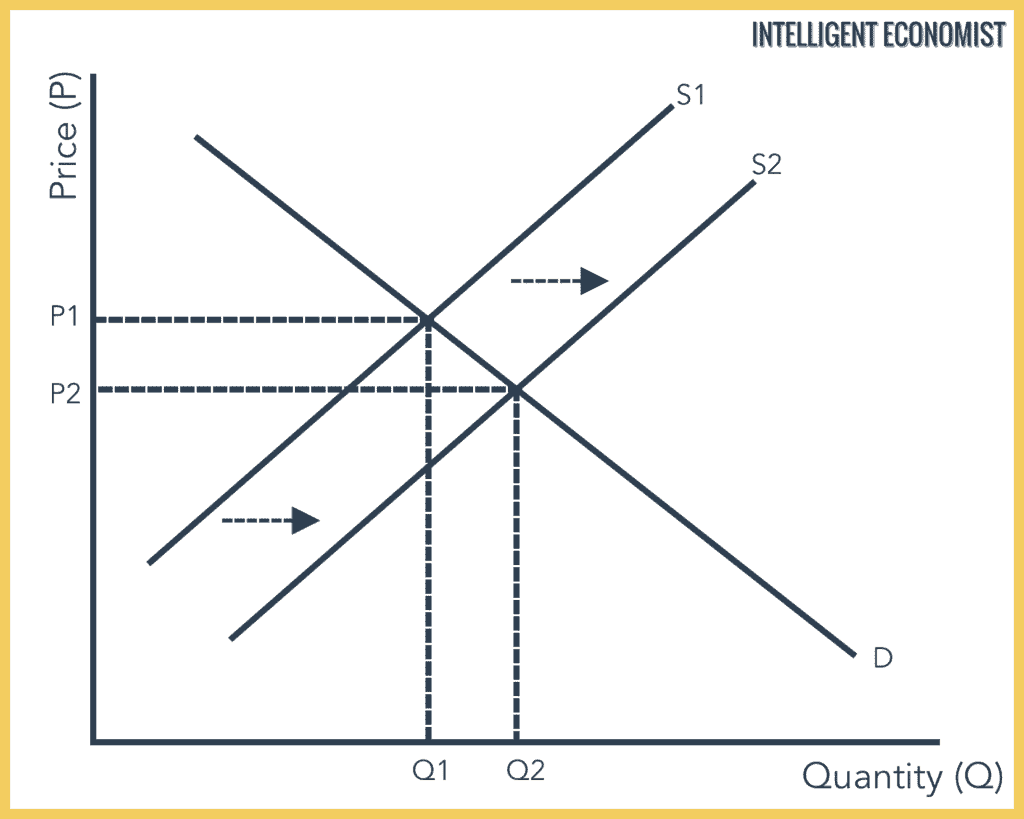
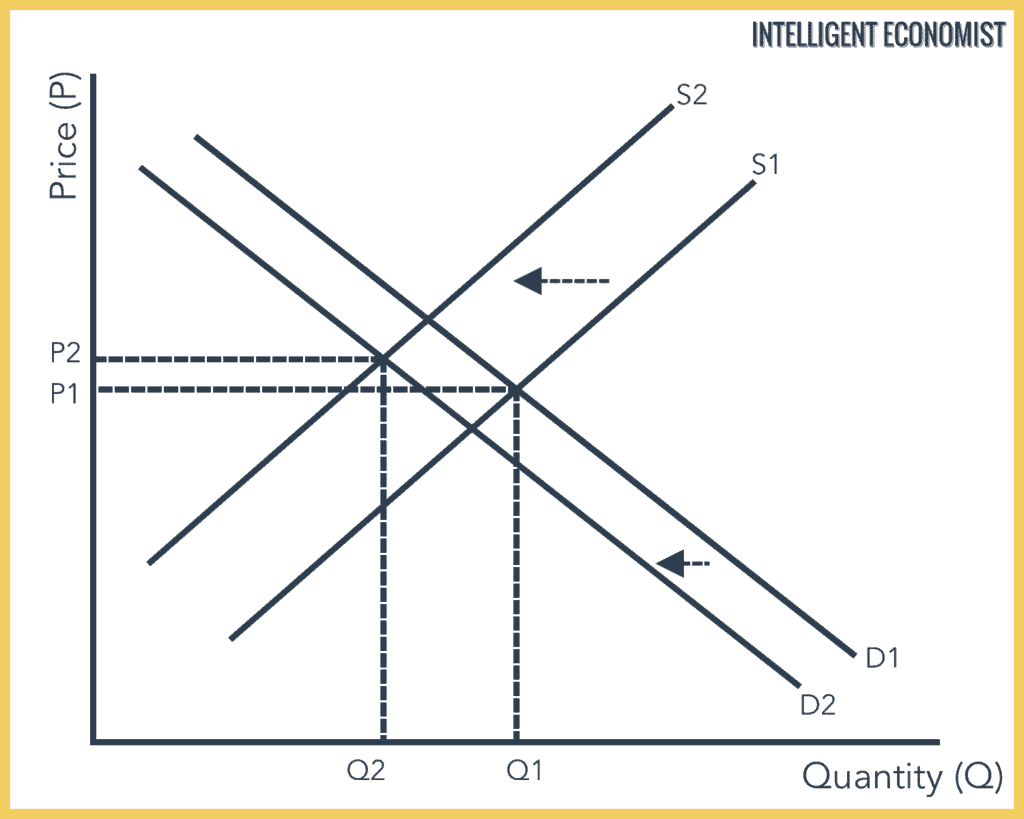
Determinants are factors that can cause the entire supply curve to increase or decrease. When there is an increase in supply (see graph below), the supply curve will shift to the right. At every price level, there is an increase in quantity supplied. When there is a decrease in supply (see graph below), the supply curve will shift to the left. At every price level, there is a decrease in quantity supplied.
There are several determinants of supply that cause the shift to the right (increase in supply) or the shift to the left (decrease in supply). We are going to use the acronym R-O-T-T-E-N as a way to remember all of the determinants.
- R - Resources
- O - Other good prices
- T - Taxes
- T - Technology
- E - Expectations of the supplier
- N - Number of competitors
If supply increases (shift to the right) it could be due to the following changes:
- R - Resources increase ⬆️
- O - Other good prices' decrease ⬇️
- T - Taxes (and other government regulations) decrease ⬇️
- T - Technology increases ⬆️
- E - Expectations of the supplier increase ⬆️
- N - Number of competitors decrease ⬇️
If supply decreases (shift to the left) it could be due to the following changes:
- R - Resources decrease ⬇️
- O - Other good prices' increase ⬆️
- T - Taxes (and other government regulations) increase ⬆️
- T - Technology decrease ⬇️
- E - Expectations of the supplier decrease ⬇️
- N - Number of competitors increase ⬆️
💡Remember: A change in quantity supplied and a shift in supply are two distinct transformations. A decrease or increase of supply happens due to a variety of factors, whereas the change in quantity supplied happens solely due to a change in price.
Frequently Asked Questions
What is opportunity cost and how do I calculate it?
Opportunity cost is the value of the next-best alternative you give up when you make a choice—it’s what you sacrifice to get something else. It can be explicit (money you spend) or implicit (time, forgone income). To calculate it, identify the best alternative you didn’t choose and measure its value. Quick method: - List choices and their benefits (dollars, utility, output). - Pick the highest-value option you didn’t choose—that value is the opportunity cost. Example: You can work a part-time job for $120 or study for an economics test that could raise your scholarship by $300. If you work, the opportunity cost = $300 (the next-best forgone benefit). If you study, the opportunity cost = $120. On the AP exam show your work and units (CED requires calculations be shown). For more practice and examples, check the Topic 1.5 study guide (https://library.fiveable.me/ap-macroeconomics/unit-1/supply/study-guide/auVQK1N9VWZQ0TOeix3K), the Unit 1 overview (https://library.fiveable.me/ap-macroeconomics/unit-1), and tons of practice problems (https://library.fiveable.me/practice/ap-macroeconomics).
I don't understand the difference between explicit and implicit opportunity costs - can someone explain?
Opportunity cost = the value of the next-best alternative you give up. Explicit opportunity costs are out-of-pocket, dollar costs you can see on a receipt. Implicit opportunity costs are the non-monetary, forgone benefits that don’t show up as cash spent. Quick example: you quit a job that paid $30,000/year to start a business. Explicit cost = $5,000 you pay for supplies. Implicit cost = $30,000 in lost salary (the next-best alternative). Total economic cost = explicit + implicit = $35,000. AP CED expects you to recognize both kinds when calculating total cost (EK CBA-1.A.1) and use them when comparing total benefits and total costs to find the optimal choice (EK CBA-1.B.1). For more practice and worked examples tied to Unit 1, check the Topic 1.5 study guide (https://library.fiveable.me/ap-macroeconomics/unit-1/supply/study-guide/auVQK1N9VWZQ0TOeix3K) and try practice problems (https://library.fiveable.me/practice/ap-macroeconomics).
How do I know when to use total benefits vs marginal benefits in cost-benefit analysis?
Use total benefits/costs when the choice can’t be broken into small, repeatable increments—you compare total net benefit (total benefits − total costs) across complete alternatives and pick the option with the highest total net benefit (CED EK CBA-1.B.1). Use marginal benefit/marginal cost when decisions are incremental (you can add or remove one more unit/activity). Then the optimal choice is where MB = MC (or where the last incremental MB ≥ MC), because marginal analysis finds the point that maximizes total net benefits (CED EK CBA-1.B.2). Quick rules of thumb: - Whole-option choices (choose plan A, B, or C): use total benefits/costs and a table or graph. - Continuous/quantity choices (how many units to produce, how many hours to study): use marginal analysis and stop where MB = MC. On the exam, free-response often wants a total net-benefit comparison or a marginal MB/MC graph—practice both (see the Topic 1.5 study guide (https://library.fiveable.me/ap-macroeconomics/unit-1/supply/study-guide/auVQK1N9VWZQ0TOeix3K) and more practice problems (https://library.fiveable.me/practice/ap-macroeconomics)).
What's the difference between total cost and opportunity cost?
Total cost = the full economic cost you add up when evaluating a decision: it includes explicit (out-of-pocket) costs plus implicit costs (the value of resources you could’ve used elsewhere). Opportunity cost = the single best forgone alternative—what you give up when you choose one option over the next-best. So opportunity cost is a component of total cost (the implicit part), while total cost is the complete sum used to compare to total benefits to get net benefit (Total net benefits = Total benefits − Total costs; EK CBA-1.A.1 and EK CBA-1.B.1). For AP problems, remember to list explicit costs (money spent) and implicit costs (time, earnings, rent foregone) and use total costs when choices can’t be broken into increments; use marginal cost/benefit when decisions are incremental (CED Topic 1.5). Want more practice or a quick refresher? Check the Topic 1.5 study guide (https://library.fiveable.me/ap-macroeconomics/unit-1/supply/study-guide/auVQK1N9VWZQ0TOeix3K) and thousands of practice questions (https://library.fiveable.me/practice/ap-macroeconomics).
How do I calculate total net benefits from a table or graph?
Start by listing total benefit (TB) and total cost (TC) for each possible choice (from a table) and compute total net benefit = TB − TC. Do that for every option and pick the choice with the largest net benefit—that’s the optimal choice per EK CBA-1.B.1. Example: Choice A TB = $100, TC = $60 → net = $40; Choice B TB = $130, TC = $100 → net = $30 → choose A. On a graph, plot TB and TC (or draw both curves). Total net benefit at any quantity is the vertical distance TB − TC; the maximum vertical distance is the optimal output. Note: some problems let you use marginal analysis, but if choices aren’t incremental you must compare total benefits and costs (EK CBA-1.B.2, EK CBA-1.A.1). For more practice and examples, see the Topic 1.5 study guide (https://library.fiveable.me/ap-macroeconomics/unit-1/supply/study-guide/auVQK1N9VWZQ0TOeix3K) and the unit page (https://library.fiveable.me/ap-macroeconomics/unit-1).
When should I compare marginal benefit and marginal cost instead of total benefit and total cost?
Use marginal comparison when the choice can be broken into small, repeatable increments (like how many hours to study, how many widgets to produce, or whether to buy one more slice of pizza). In those cases you compare marginal benefit (MB) to marginal cost (MC) for the next unit—you keep doing the activity while MB ≥ MC and stop where MB = MC. That’s the marginal-rule for the optimal choice (net benefit maximized at the margin). This aligns with the CED (EK CBA-1.B.2). Use total benefit vs total cost when the decision is a one-off or can’t be meaningfully split into increments (accepting a job vs not, building a factory). Then calculate total net benefit (total benefits − total costs) and pick the option with the highest total net benefit (EK CBA-1.A.1, CBA-1.B.1). Don’t let sunk costs matter—ignore them. For more examples and AP-style practice, see the Topic 1.5 study guide (https://library.fiveable.me/ap-macroeconomics/unit-1/supply/study-guide/auVQK1N9VWZQ0TOeix3K) and try problems at (https://library.fiveable.me/practice/ap-macroeconomics).
I'm confused about utility for consumers vs total revenue for firms - aren't they the same thing?
Short answer: they’re related but not the same. The CED calls both of these “total benefits”—for consumers total benefit = utility (subjective satisfaction, measured in utils or preference), while for firms total benefit = total revenue (price × quantity, an objective dollar amount). When you do cost-benefit analysis you compare whichever total benefit applies to the decision (utility for a consumer, total revenue for a firm) to total cost to get net benefit and pick the option that maximizes net benefit (EK CBA-1.A.2, CBA-1.B.1). Quick extra points for AP prep: consumers often think in marginal utility vs marginal cost for incremental choices; firms often use marginal revenue and marginal cost. But some choices require comparing total benefits and total costs instead of marginal analysis (EK CBA-1.B.2). For more review, see the Topic 1.5 study guide (https://library.fiveable.me/ap-macroeconomics/unit-1/supply/study-guide/auVQK1N9VWZQ0TOeix3K) and Unit 1 resources (https://library.fiveable.me/ap-macroeconomics/unit-1). For practice, try the AP Macro question bank (https://library.fiveable.me/practice/ap-macroeconomics).
How do I find the optimal choice on a cost-benefit analysis graph?
Find the option where total net benefit (total benefit − total cost) is largest. On a cost-benefit graph you usually have total benefit and total cost on the vertical axis and possible choices on the horizontal axis. The optimal choice is where the vertical distance between the benefit and cost curves is greatest—that point maximizes total net benefits (CED EK CBA-1.B.1). If the decision can be broken into small increments, use marginal analysis: choose the quantity where marginal benefit = marginal cost (MB = MC); beyond that point MC > MB, so extra units reduce net benefit (CED EK CBA-1.A.1, EK CBA-1.B.2). On the AP free-response, label axes, show the curves, and clearly indicate the maximizing point (graphing skills are tested—Skill 4). For a quick review and example graphs, see the Topic 1.5 study guide (https://library.fiveable.me/ap-macroeconomics/unit-1/supply/study-guide/auVQK1N9VWZQ0TOeix3K) and try practice problems (https://library.fiveable.me/practice/ap-macroeconomics).
What does it mean when they say "rational agents consider opportunity costs"?
It means when you make a choice you don’t just count the money you pay—you also count what you give up. Opportunity cost = the next-best alternative foregone. Rational agents (people/firms) include both explicit costs (out-of-pocket) and implicit costs (non-monetary or forgone earnings) when calculating total economic cost (EK CBA-1.A). Quick example: going to college might cost $20,000 tuition (explicit) plus $30,000 in forgone wages (implicit) → total economic cost = $50,000. You compare that total cost to total benefits (utility or revenue) and pick the option that maximizes net benefit (EK CBA-1.B.1). For marginal decisions, compare marginal benefit to marginal cost; for “all-or-nothing” choices, compare total benefits and total costs. For AP review, see the Topic 1.5 study guide (https://library.fiveable.me/ap-macroeconomics/unit-1/supply/study-guide/auVQK1N9VWZQ0TOeix3K) and practice problems (https://library.fiveable.me/practice/ap-macroeconomics).
Can you give me a real world example of implicit vs explicit costs?
Explicit costs are out-of-pocket payments—wages, rent, materials. Implicit costs are forgone earnings from the next-best use of your own resources (opportunity cost). Real example: you quit a $50,000/year job to start a cafe. Explicit costs: $30,000 in rent + $20,000 in supplies = $50,000. Implicit cost: the $50,000 salary you gave up. Total economic cost = explicit ($50,000) + implicit ($50,000) = $100,000. A rational agent compares total benefits (revenue/utility) to that total cost when deciding whether to open the cafe (CED EK CBA-1.A.1). On the AP exam you may need to show this in a cost-benefit table or calculation, and sometimes marginal vs total analysis (CED EK CBA-1.B.1). For a quick review, see the Topic 1.5 study guide (https://library.fiveable.me/ap-macroeconomics/unit-1/supply/study-guide/auVQK1N9VWZQ0TOeix3K) and practice problems (https://library.fiveable.me/practice/ap-macroeconomics).
How do I calculate opportunity cost when there are multiple alternatives to choose from?
Opportunity cost with multiple alternatives = the value of the next-best forgone option. In practice: 1) List all alternatives and their total benefits and total costs (include explicit and implicit costs). 2) Compute net benefit = total benefit − total cost for each alternative (CED: total net benefits). 3) Rank alternatives by net benefit. If you choose option A, your opportunity cost = the net benefit of the highest-ranking alternative you didn’t pick (the next-best). If choices aren’t divisible, use total rather than marginal analysis (EK CBA-1.B.2). If choices can be split, compare marginal benefit and marginal cost instead. Show your work on the exam (calculate net benefits in a table or graph—the AP free-response rubric expects clear calculations). For a refresher, see the Topic 1.5 study guide (https://library.fiveable.me/ap-macroeconomics/unit-1/supply/study-guide/auVQK1N9VWZQ0TOeix3K) and more Unit 1 review (https://library.fiveable.me/ap-macroeconomics/unit-1). Practice problems are at (https://library.fiveable.me/practice/ap-macroeconomics).
I don't understand why we maximize total net benefits - why not just maximize total benefits?
You maximize total net benefits (total benefits minus total costs) because a choice can have big benefits but even bigger costs—what matters is the gain after you pay those costs. The CED’s EK CBA-1.A.1 and EK CBA-1.B.1 say rational agents include opportunity costs (explicit and implicit) and pick the option that maximizes net benefit. Example: option A gives $100 benefit but $90 cost → net $10. Option B gives $80 benefit and $20 cost → net $60. B is optimal even though A had higher total benefit. Ignoring costs would ignore opportunity cost and could lead you to choose a worse outcome. For some problems you can use marginal analysis, but when decisions aren’t incremental you must compare total benefits and total costs to find the maximum total net benefit (CED EK CBA-1.B.2). For practice, see the Topic 1.5 study guide (https://library.fiveable.me/ap-macroeconomics/unit-1/supply/study-guide/auVQK1N9VWZQ0TOeix3K) and more practice problems (https://library.fiveable.me/practice/ap-macroeconomics).
What's the relationship between opportunity cost and the production possibilities frontier?
Opportunity cost is what you give up when you choose one option over another—the next-best alternative. The production possibilities frontier (PPF) is the visual tool that shows those trade-offs: any point on the PPF uses all resources, so moving from one point to another shows the opportunity cost (how many of good A you must sacrifice to get more of good B). If the PPF is bowed out, opportunity costs rise as you reallocate resources (increasing marginal opportunity cost). If it’s a straight line, opportunity cost is constant. On the AP exam you’ll need to explain and calculate opportunity cost from a PPF or table (CED EK CBA-1.A.1 and related objectives). Practice reading PPF moves, compute units lost/gained, and use marginal vs. total comparisons. For a quick refresh see the Topic 1.5/PPF study guide (https://library.fiveable.me/ap-macroeconomics/unit-1/supply/study-guide/auVQK1N9VWZQ0TOeix3K) and try problems at (https://library.fiveable.me/practice/ap-macroeconomics).
How do I know if a decision can be broken down into marginal analysis or if I need to look at total costs and benefits?
Use marginal analysis when the choice can be made in small, repeatable increments so you can compare marginal benefit (MB) to marginal cost (MC) for each extra unit—stop where MB = MC. Examples: how many hours to study, how many widgets to produce, or whether to hire one more worker. This is exactly what EK CBA-1.B.2 means: some decisions can be broken into increments. Use total cost–benefit when the decision is indivisible or a one-time lump-sum choice that can’t be split into marginal units. Examples: buy a house, pick a college, or accept a single job offer. For those, calculate total benefits − total costs and choose the option with the highest total net benefit (EK CBA-1.B.1). Also watch for sunk costs (ignore them) and include implicit/explicit opportunity costs (EK CBA-1.A.1). For more AP-aligned examples and practice, see the Topic 1.5 study guide (https://library.fiveable.me/ap-macroeconomics/unit-1/supply/study-guide/auVQK1N9VWZQ0TOeix3K) and try practice problems (https://library.fiveable.me/practice/ap-macroeconomics).
Why do economists always assume people are rational when making decisions about costs and benefits?
Economists assume people are rational because it gives a clear, testable benchmark: agents weigh total benefits against total costs (including opportunity costs, explicit and implicit) and choose the option that maximizes net benefit or utility (EK CBA-1.A.1, CBA-1.B.1). That assumption makes tools like marginal analysis useful—if people are rational, you can compare marginal benefit to marginal cost to find the optimal choice. Rationality is a simplifying assumption, not a claim people are perfect or always have full information. It just means choices are purposeful (they respond to incentives, ignore sunk costs, and consider trade-offs). For the AP exam, you’ll use this idea to set up cost–benefit tables/graphs and explain optimal choices (Topic 1.5). Want practice applying it? Check the Unit 1 study guide (https://library.fiveable.me/ap-macroeconomics/unit-1/supply/study-guide/auVQK1N9VWZQ0TOeix3K) and try problems at (https://library.fiveable.me/practice/ap-macroeconomics).