When taking a look at the periodic table, you may wonder how scientists discovered all these numbers! As we discussed in the last section of this unit, an atom is made up of protons, neutrons, and electrons. Understanding these three subatomic particles and how they contribute to the makeup of the periodic table is significant.
Review of the Periodic Table ⚗️
On the periodic table, you can find the following information for each element:
- Element symbol: Each element is represented by a unique symbol, typically consisting of one or two letters.
- Atomic number: The atomic number of each element, found above the element symbol, represents the number of protons in the nucleus of the atom of that element. It is also the number of electrons in a neutral atom of that element, which we will discuss more later in this unit.
- Atomic mass: The atomic mass of an element is found below the element symbol and is typically expressed in atomic mass units (amu). The atomic mass is a representation of the number of protons in an atom of that element + the number of neutrons in an atom of that element. This will be our focus The atomic mass of elements represented on the periodic table will be our focus in this guide!


The Average Atomic Mass of an Element
Let's take a look at carbon on theperiodic table that will be given to you during the AP exam:

Here is what we know so far about carbon based on the periodic table:
- Carbon is represented by the element symbol "C."
- Carbon's atomic number is 6, which means one atom of carbon has 6 protons in its nucleus and 6 electrons orbiting its nucleus.
- Carbon's atomic mass looks to be 12.01, but how would this make sense? Since atomic mass = protons + neutrons, and we know we have 6 protons, that would give us 6.01 neutrons. As you may realize, this is impossible. Instead of a nice "12" or "13" under Carbon, there's a really messy decimal of 12.01. If you take a look at other elements on the periodic table, you'll notice a similar trend. Hydrogen has an atomic mass of 1.008, and iron (Fe) has an atomic mass of 55.85.
This is all because the atomic masses that you're given on the periodic table are actually the average atomic masses of these elements. The average atomic mass of an element is the weighted average of the masses of the naturally occurring isotopes of that element, based on their relative abundances.
🎥 Watch Jacob Jeffries discuss the parts of the atom and the experiments scientists use to study them.
What are isotopes?
Isotopes are variants of an element. They have the same number of protons and electrons, but a different number of neutrons. This means that isotopes have the same atomic number (number of protons) but a different atomic mass (total number of protons and neutrons).
Therefore, the average atomic mass represents all of the isotopes of an atom, and how often they occur naturally in the environment. Let's break this down further. 🤔
Carbon's 3 Naturally Occurring Isotopes
There are three naturally occurring isotopes of carbon: carbon-12, carbon-13, and carbon-14.
- Carbon-12 is the most abundant isotope of carbon, making up about 98.9% of naturally occurring carbon. It has an atomic mass of 12 amu and is stable. Carbon-12 has 6 neutrons, which is calculated by taking the mass number of 12 and subtracting 6 protons.
- Carbon-13 is a less abundant isotope of carbon, making up about 1.1% of naturally occurring carbon. It has an atomic mass of 13 amu and is also stable. Carbon-13 has 7 neutrons: mass number of 13 - 6 protons
- Carbon-14 is a rare isotope of carbon, making up about 1 part per trillion of naturally occurring carbon. It has an atomic mass of 14 amu and is radioactive. Fun fact, carbon-14 is produced in the Earth's atmosphere through the interaction of cosmic rays with nitrogen atoms. 💥- Also, since carbon-14 is found in small amounts in all living organisms, this is what is used when carbon dating and determining the age of organic materials discovered.- Since there is barely any carbon-14 naturally occurring on Earth, we do not have to account for it when calculating the average atomic mass.
Calculating Carbon's Average Atomic Mass
So how do we calculate the average atomic mass of 12.01 knowing this information about carbon's naturally occurring isotopes? Here is what we know so far:
- Carbon's 2 main isotopes, Carbon-12 and Carbon-13, account for roughly 100% of the Carbon in nature.
- 98.9% of all carbon in nature is carbon-12, and the remaining 1.1% is carbon-13.
The average atomic mass of an element can be calculated using the following formula:
Average atomic mass = (abundance of isotope 1 x mass of isotope 1) + (abundance of isotope 2 x mass of isotope 2) + ... +
To calculate the average atomic mass of carbon from this data:
AAM = 0.989(12) + 0.011(13) = 12.01, which is the same as the number on the periodic table.
Let's see what would happen if we changed the numbers. Let's say now the chemist finds that only 75% of the carbon in nature was carbon-12 and 25% was carbon-13. Now, the AAM is:
AAM = 0.75(12) + 0.25(13) = 12.25
As you can see, the abundance of isotopes can have a significant effect on the average atomic mass of an element. If you are only given the mass numbers 12 and 13, as well as the average atomic mass, you can easily tell which isotope exists in greater amounts in nature. Since 12.01 is much closer to 12 than 13 is, Carbon-12 is clearly more abundant.
Always convert the % given to a decimal when calculating the average atomic mass.
Mass Spectroscopy 📊
Mass spectrometry is a technique used to measure the mass and relative abundance of ions in a sample. This technique produces a graph, called the mass spectrum, that allows us to identify different isotopes of an element and the relative abundance of each isotope in nature.
Mass Spectrum of Carbon ✏️
Looking at the mass spectrum of the element carbon, we can identify the isotopes of carbon as carbon-12 and carbon-13.
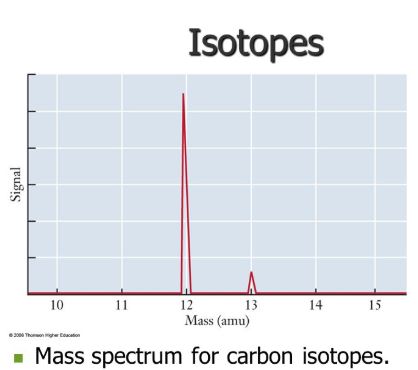
The fact that carbon-12 gives a significantly greater signal tells us that carbon-12 is much more abundant than carbon-13 in nature.
Putting Isotopes and Mass Spectrums Together
Let's put all of this information together and try to identify an element just from its mass spectrum. Here is an example:
The peaks below show a mass spectrum of element X. What is element X based on this spectrum? What is its average atomic mass?
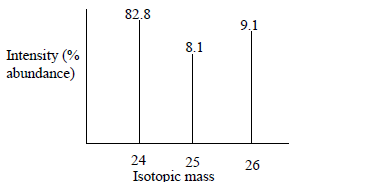
Without a calculator, you can easily tell that the average atomic mass is going to be somewhere between 24 and 25 since X-24 has the greatest % natural abundance. However, let's do some work! Here is what you should do when approaching this problem:
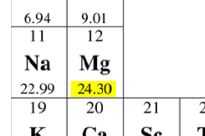
AAM = 0.828(24) + 0.081(25) + 0.091(26) = 24.263. This tells us that element X has an average atomic mass of approximately 24.3. When looking at the periodic table, we can identify this element as Magnesium:
Sample AP Question - 2007 Exam
Part a of question 2 on the AP Chemistry 2007 Exam (Form B) includes basic stoichiometry and advanced mass spectrum calculations. Here it is:
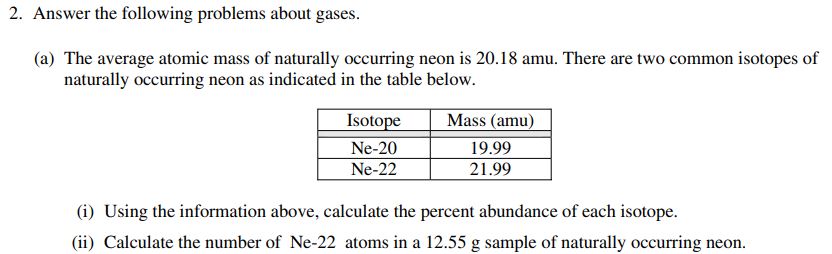
Question 2a: Part i
Instead of giving you the graph and asking you to solve for the average atomic mass, they are giving you the average atomic mass and asking you to solve for the percent abundance.
Don't worry! As long as you remember the basic formula, you can solve this problem:
AAM = (natural abundance)(mass) + ... + (natural abundance)(mass)
Now, just plug in what you know!
20.18 = (natural abundance)(19.99) + (natural abundance)(21.99)
One crucial piece of information that you have to remember for this question is that the percent abundances add up to 100%. This allows us to have x as one natural abundance and 1-x as the other, as you have probably done in previous algebra classes. Therefore, the setup for this problem is:
20.18 = (x)(19.99) + (1-x)(21.99)
Once you solve for x, you would get x = 0.905. Therefore, the percent abundance for Ne-20 is 90.5% and the percent abundance for Ne-22 is 9.5% (100%-90.5%).
Question 2a: Part ii
To recall from the last guide, you always want to put the value you know first when doing dimensional analysis. Well, how do you even know you have to do stoichiometry? This question is asking you to convert from grams to atoms which should give you a signal that dimensional analysis should be performed. Try this problem on your own first but here is the setup:
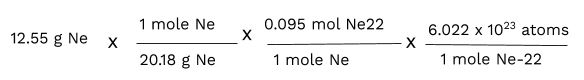
In the first conversion step, you are simply using the molar mass of neon on the periodic table. In the second conversion step, you are using the ratio of Ne to Ne-22, which is the percent abundance you found in part i. Then, you use Avogadro's number to convert to atoms and you get the answer of 3.558 x 10^22 Ne-22 atoms.
You got this! 😊
Frequently Asked Questions
What is a mass spectrum and how does it show different isotopes?
A mass spectrum is a graph from a mass spectrometer that plots mass-to-charge ratio (m/z) on the x-axis and peak intensity on the y-axis. For an element, each isotope produces a peak at its isotopic mass (usually m/z ≈ the isotope’s mass because ions are singly charged monatomic ions on the AP exam). Peak heights (intensities) show relative abundance—taller peaks mean that isotope is more common in nature. From those peaks you can identify isotopic masses and percent abundances and then calculate average atomic mass as a weighted average (Σ(mass × fractional abundance)). Remember AP topic 1.2 only tests single-element samples and singly charged monatomic ions, so you won’t need to interpret molecular fragments or multiply-charged species. For a focused review, see the Topic 1.2 study guide on Fiveable (https://library.fiveable.me/ap-chemistry/unit-1/mass-spectroscopy-elements/study-guide/B4IVhweYImJO0nU86Kq7) and try practice problems at (https://library.fiveable.me/practice/ap-chemistry).
How do you read a mass spectra graph for an element?
Read a mass spectrum the same way you read a picture of an element’s isotopes. Steps: - Look at the x-axis (m/z): for singly charged monatomic ions on the AP exam m/z ≈ isotopic mass (amu). Each distinct peak = one isotope (CED 1.2.A.1). - Read the peak heights (intensity) on the y-axis: they give relative abundance. Convert heights to percent abundance if you need to calculate averages. - Calculate average atomic mass by a weighted average: average = Σ(isotope mass × fractional abundance) (CED 1.2.A.2). Example: if peaks at 35 (75%) and 37 (25%), average = 0.75×35 + 0.25×37 = 35.5 amu. - Only consider singly charged monatomic ions and single-element samples on AP questions (exclusion in CED). - Practice with the Topic 1.2 study guide (https://library.fiveable.me/ap-chemistry/unit-1/mass-spectroscopy-elements/study-guide/B4IVhweYImJO0nU86Kq7) and more practice problems (https://library.fiveable.me/practice/ap-chemistry).
Why do elements have multiple peaks on their mass spectrum?
You see multiple peaks because a natural element is a mixture of isotopes—atoms with the same Z (protons) but different numbers of neutrons, so slightly different masses. In a mass spectrometer those isotopes are ionized (usually as singly charged monatomic ions), separated by mass-to-charge ratio (m/z), and recorded as peaks. Each peak’s position tells you an isotope’s mass (usually ~1 amu apart for different neutron counts); the peak height (intensity) is proportional to that isotope’s relative abundance. From those m/z values and relative abundances you can identify isotopes and calculate the element’s average atomic mass by a weighted average (what the AP CED expects for Topic 1.2). Small shifts from whole-number masses come from mass defects/nuclear binding energy. For more practice on reading spectra and computing weighted averages, check the Topic 1.2 study guide (https://library.fiveable.me/ap-chemistry/unit-1/mass-spectroscopy-elements/study-guide/B4IVhweYImJO0nU86Kq7) and the AP practice problems (https://library.fiveable.me/practice/ap-chemistry).
What's the difference between isotopic mass and average atomic mass?
Isotopic mass (also called isotopic or monoisotopic mass) is the actual mass of one specific isotope of an element measured in atomic mass units (amu)—e.g., 35Cl ≈ 34.969 amu, 37Cl ≈ 36.966 amu. A mass spectrum shows those isotopic masses as peaks at their m/z values (CED 1.2.A.1). Average atomic mass is the weighted average of all naturally occurring isotopes’ masses, using their relative (percent) abundances: average = Σ(isotopic mass × fractional abundance) (CED 1.2.A.2). That’s the number on the periodic table (e.g., Cl ≈ 35.45 amu) and is what you use in mole/molar-mass calculations. On the AP exam you may be asked to use a mass spectrum to read isotope masses and abundances and then compute the weighted average (practice this from the Topic 1.2 study guide: https://library.fiveable.me/ap-chemistry/unit-1/mass-spectroscopy-elements/study-guide/B4IVhweYImJO0nU86Kq7). For more review or lots of practice questions, see the Unit 1 overview (https://library.fiveable.me/ap-chemistry/unit-1) and practice bank (https://library.fiveable.me/practice/ap-chemistry).
I'm confused about how to calculate average atomic mass from mass spectra data - can someone explain?
A mass spectrum gives you the isotopic masses (m/z of each peak for singly charged monatomic ions) and their relative abundances (peak heights or intensities). To get average atomic mass, do a weighted average: multiply each isotope’s mass by its fractional abundance, then add them. Steps: 1. Read the m/z values (isotopic masses) and convert peak heights to fractions that sum to 1 (percent abundance ÷ 100). 2. Compute sum(mass_i × fraction_i). 3. Report in amu. Quick example: peaks at 63.93 amu (69.17%) and 65.93 amu (30.83%): fraction1 = 0.6917, fraction2 = 0.3083 avg mass = 63.93×0.6917 + 65.93×0.3083 = 64.31 amu On the AP exam you’ll only see single-element spectra of singly charged monatomic ions, so m/z ≈ isotopic mass (CED 1.2.A). For a refresher, check the Topic 1.2 study guide (https://library.fiveable.me/ap-chemistry/unit-1/mass-spectroscopy-elements/study-guide/B4IVhweYImJO0nU86Kq7) and try practice problems (https://library.fiveable.me/practice/ap-chemistry).
How do you find the relative abundance of isotopes from a mass spectrum?
Read the peaks: each peak’s m/z on a mass spectrum (for singly charged monatomic ions) matches an isotope’s mass and the peak height (intensity) is proportional to that isotope’s relative abundance. To get percent abundance: 1. Identify the isotope masses (m/z values) for each peak. 2. Record each peak’s intensity (height or area). 3. Add all intensities to get the total. 4. For each isotope: (intensity ÷ total) × 100% = percent (relative) abundance. Example: peaks with intensities 80 and 20 → total 100; abundances 80% and 20%. You can then compute average atomic mass by the weighted average: sum(mass × fractional abundance). Remember AP exam rules: spectra will be single-element, singly charged monatomic ions (so m/z ≈ isotopic mass)—mixtures or multiply charged species aren’t tested (CED 1.2.A). For a short study guide and practice problems, see the Topic 1.2 study guide (https://library.fiveable.me/ap-chemistry/unit-1/mass-spectroscopy-elements/study-guide/B4IVhweYImJO0nU86Kq7) and unit resources (https://library.fiveable.me/ap-chemistry/unit-1); over 1000 practice questions are at (https://library.fiveable.me/practice/ap-chemistry).
What does each peak on a mass spectrum represent?
Each peak on an element’s mass spectrum corresponds to a singly charged monatomic ion (m/z ≈ the isotope’s mass in amu). The x-position (m/z) tells you the isotopic mass; the peak height (intensity) tells you that isotope’s relative (percent) abundance in a natural sample. For a single-element spectrum (what AP will test), the set of peaks = the element’s different isotopes; you use the masses and their relative abundances as a weighted average to estimate the element’s atomic mass (see CED 1.2.A.1–1.2.A.2). Don’t assume peaks are molecules or multiply charged species—the AP excludes those complexities. Want a quick review or worked examples on reading isotope peaks and computing average atomic mass? Check the Topic 1.2 study guide (https://library.fiveable.me/ap-chemistry/unit-1/mass-spectroscopy-elements/study-guide/B4IVhweYImJO0nU86Kq7) and practice questions (https://library.fiveable.me/practice/ap-chemistry).
Why is the average atomic mass on the periodic table different from the mass numbers of isotopes?
Isotopes have different mass numbers (whole-number counts of protons + neutrons) and slightly different isotopic masses (in amu). The periodic-table “average atomic mass” isn’t any single isotope’s mass—it’s the weighted average of all naturally occurring isotopes, using each isotope’s mass and its relative (percent) abundance. So if an element has two isotopes (10.0 amu at 25% and 11.0 amu at 75%), the average = 0.25·10 + 0.75·11 = 10.75 amu. That’s why the table value is often non-integer. Also remember mass defects and binding energy make precise isotopic masses slightly different from simple nucleon counts; mass spectra give you the isotope peaks (m/z) and peak intensities used to determine those abundances (CED 1.2.A.1–1.2.A.2). For a focused review and example calculations, check the Topic 1.2 study guide (https://library.fiveable.me/ap-chemistry/unit-1/mass-spectroscopy-elements/study-guide/B4IVhweYImJO0nU86Kq7). For extra practice problems, see Fiveable’s AP Chem practice page (https://library.fiveable.me/practice/ap-chemistry).
How do I use mass spectra data to identify which element I'm looking at?
Look at the peaks (m/z) and their relative heights. For a sample that’s a single element (singly charged monatomic ions only, per the CED), each peak’s m/z equals an isotope’s mass number (approximately the isotopic mass in amu) and the peak heights give relative abundances. Steps: (1) read the m/z values to identify possible isotope masses (e.g., 63 and 65 → Cu isotopes). (2) convert peak heights into percent or fractional abundances. (3) calculate the weighted average atomic mass (Σ isotope mass × fractional abundance). (4) compare that average to the atomic masses on the periodic table to pick the element. Remember AP will only test single-element spectra and assume +1 charge. For a quick review, see the Topic 1.2 study guide (https://library.fiveable.me/ap-chemistry/unit-1/mass-spectroscopy-elements/study-guide/B4IVhweYImJO0nU86Kq7) and try practice problems (https://library.fiveable.me/practice/ap-chemistry).
What's the relationship between peak height and isotope abundance in mass spectrometry?
Peak height (peak intensity) on a mass spectrum is directly proportional to the relative abundance of that isotope in the sample—for singly charged monatomic ions. So if isotope A is twice as abundant as isotope B, A’s peak will be about twice as tall. The x-axis (m/z) gives the isotopic masses; the y-axis (intensity) gives relative abundance you can convert to percent and use in a weighted average to estimate atomic mass (CED 1.2.A.1–A.2). On the AP exam you’ll only be asked about single-element samples and singly charged monatomic ions, so you can treat peak height as proportional to natural abundance (ignore fragmentation/other species per the exclusion statement). For practice and quick review, see the Topic 1.2 study guide (https://library.fiveable.me/ap-chemistry/unit-1/mass-spectroscopy-elements/study-guide/B4IVhweYImJO0nU86Kq7), the Unit 1 overview (https://library.fiveable.me/ap-chemistry/unit-1), and lots of practice problems (https://library.fiveable.me/practice/ap-chemistry).
Can you explain step by step how to calculate weighted average atomic mass from mass spectrum data?
Step-by-step: read the mass spectrum, identify isotope masses (m/z peaks for singly charged monatomic ions) and their relative abundances (peak heights or percent). Convert abundances to decimals (percent ÷ 100). Multiply each isotope mass (in amu) by its decimal abundance to get each isotope’s weighted contribution. Sum those contributions—that total is the weighted average atomic mass (amu). Example: peaks at 35.0 amu (75.8%) and 37.0 amu (24.2%): 35.0×0.758 + 37.0×0.242 = 26.53 + 8.95 = 35.48 amu. Notes tied to the CED: use monatomic, singly charged peaks and relative abundance from the spectrum (1.2.A.1–1.2.A.2). On the AP exam you may be asked to estimate average atomic mass from given isotope masses and percent abundances—show your multiplication and final sum. For a focused review see the Topic 1.2 study guide (https://library.fiveable.me/ap-chemistry/unit-1/mass-spectroscopy-elements/study-guide/B4IVhweYImJO0nU86Kq7) and practice questions (https://library.fiveable.me/practice/ap-chemistry).
Why do some isotopes show up as bigger peaks than others on mass spectra?
On a mass spectrum the peak height (intensity) shows how many ions of a given mass-to-charge (m/z) hit the detector—so bigger peaks mean that isotope is more abundant in the sample (more ions created). For a single element, each isotope gives a peak at its isotopic mass (m/z for a singly charged monatomic ion); the peak intensities reflect the isotope’s relative (percent) natural abundance. Instruments also produce counts proportional to the number of ions formed and detected, so ionization efficiency can slightly affect heights, but AP-style problems assume singly charged monatomic ions and natural abundances. You use those relative intensities to compute weighted-average atomic mass (CED 1.2.A.1–2). For a quick review, check the Topic 1.2 study guide (https://library.fiveable.me/ap-chemistry/unit-1/mass-spectroscopy-elements/study-guide/B4IVhweYImJO0nU86Kq7) and more unit practice at (https://library.fiveable.me/ap-chemistry/unit-1) or practice problems (https://library.fiveable.me/practice/ap-chemistry).
I don't understand how mass spectrometry actually separates different isotopes - how does it work?
Mass spectrometry separates isotopes by turning atoms into charged particles and using their mass-to-charge ratio (m/z) to spread them out. Steps: (1) Ionization—a sample’s atoms are ionized (AP problems assume singly charged monatomic ions), so charge z = +1. (2) Acceleration—an electric field gives all ions the same kinetic energy. (3) Deflection—a magnetic (or electric) field bends ion paths: lighter ions (smaller m) are deflected more than heavier ones because m/z controls the curvature. Since z = 1, m/z ≈ m, so each isotope lands at a different spot. (4) Detection—detectors measure peak positions (isotopic masses) and peak heights (relative abundances). From those peaks you read isotopic masses and percent abundances and compute the weighted-average atomic mass (CED 1.2.A.1–2). For practice and visuals, see the Topic 1.2 study guide (https://library.fiveable.me/ap-chemistry/unit-1/mass-spectroscopy-elements/study-guide/B4IVhweYImJO0nU86Kq7). More unit review and 1000+ practice questions are at (https://library.fiveable.me/ap-chemistry/unit-1) and (https://library.fiveable.me/practice/ap-chemistry).
What information can you get from analyzing the mass spectrum of a single element?
From the mass spectrum of a single element you can get three AP-relevant things: the masses (m/z) of its isotopes (peak positions), the relative abundances of those isotopes (peak intensities), and from those you can calculate the element’s average atomic mass as a weighted average (use isotopic mass × fractional abundance). Spectra for AP tasks assume singly charged monatomic ions, so peak m/z equals isotopic mass in amu. You can also identify the monoisotopic mass (the lightest isotope peak) and the isotope pattern (spacing shows mass differences, e.g., 1 amu between neighbors). Remember the CED excludes spectra with multiple elements or molecular/charge-varied peaks, so stick to single-element, singly charged peaks when answering exam questions. For a quick review check the Topic 1.2 study guide (https://library.fiveable.me/ap-chemistry/unit-1/mass-spectroscopy-elements/study-guide/B4IVhweYImJO0nU86Kq7) and try practice problems (https://library.fiveable.me/practice/ap-chemistry).
How do you determine percent abundance of isotopes when given a mass spectrum?
Look at the mass spectrum peaks: the x-axis gives m/z (isotopic masses for singly charged monatomic ions) and the peak heights (intensities) give relative abundance. To get percent abundance: 1) read the intensity for each isotope peak, 2) add all intensities to get the total, 3) percent abundance for an isotope = (its intensity ÷ total intensity) × 100%. Example: if peaks at m/z 35 and 37 have heights 76 and 24, total = 100, so %35 = 76% and %37 = 24%. You can then compute average atomic mass as a weighted average: (mass1×frac1 + mass2×frac2). Remember AP restrictions: spectra you’ll be asked about show a single element and singly charged monatomic ions (so m/z ≈ isotope mass)—use that when interpreting peaks (CED 1.2.A). For more practice and a clear walkthrough, check the Topic 1.2 study guide (https://library.fiveable.me/ap-chemistry/unit-1/mass-spectroscopy-elements/study-guide/B4IVhweYImJO0nU86Kq7) and many practice questions (https://library.fiveable.me/practice/ap-chemistry).