1.9 Connecting Multiple Representations of Limits
6 min read•february 15, 2024
Throughout this unit, we’ve learned how to determine (or estimate) limits from different kinds of representations, including graphs, tables, and algebraic expressions. In this topic, we’ll practice connecting these various representations.
📈Connecting Multiple Representations of Limits
To connect the numerical, graphical, and algebraic representations of limits, we have to be able to gain information from each representation individually and then figure out how the information corresponds or corroborates with each other. This will allow us to gain a more complete understanding of the behavior of the function as x approaches the limit.
For example, we can use the numerical representation to approximate the limit, and then confirm our answer by observing the graphical representation and/or determining the exact limit using the algebraic representation. Or vice versa! 🔂
An important point to note is that sometimes one representation may be more informative than the others. For example, a function that is difficult to manipulate algebraically can be graphed to understand the behavior of the function as x approaches the limit.
Here’s a quick review of each of these:
- 🔢 Numerical Representation - This is the most common method used to determine limits and involves plugging in different values of x that are close to the limit and seeing what the approaches. This data is presented in a table and gives us an approximation of the limit, not the exact solution.
- 📊 Graphical Representation - This method involves and observing the behavior of the as x approaches the limit. This method is also not an exact solution.
- 📝 Algebraic Representation - This involves using algebraic manipulation to determine the exact solution for the limit. With this, you may factor, rationalize denominators, or work with trig!
Now let’s give a question a try!
✏️ Multiple Representations of Limits: Walkthrough
Let be a function where . Which of the following could represent ?
Option A)
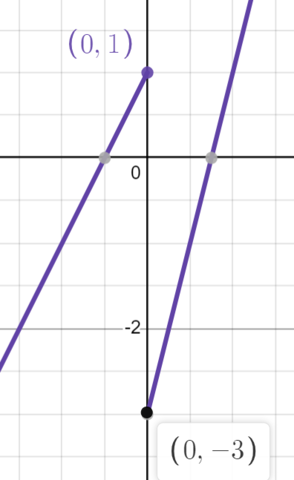
Image Courtesy of Desmos
Note: The graph has a removable discontinuity at . We’ll talk about this more in the next key topic.
Option B)
| -0.2 | -0.1 | -0.001 | 0.001 | 0.1 | 0.2 | |
| 1.04 | 1.01 | 1.000001 | 1.000001 | 1.01 | 1.04 |
Option C)
How can we tackle this problem? Well, we can look through the different options and evaluate the for each one and see if it equals . You essentially want to act like each option is on its own so you don’t get distracted by the others! 👀
📈 First, let’s take a look at the graph in a). We see that approaches as approaches from the left, but approaches and as approaches from the right. Therefore, a) is not the correct answer.
🔢 Next, if we look at the table in b), we see that as the values of approach on both the left and right sides, the values of approach , so the function depicted in b) could represent .
🤔 To confirm that b) is the correct answer, we can look at the function given in c). For values approaching on the left we see that approaches or , and for values approaching on the right we see that is . Since only one side approaches , is not equal to .
Therefore, b) is the correct answer.
📝 Limits Practice Problem
Now it’s time for you to do some practice on your own! 🔍
❓Limits Practice Question
Let be a function where . Which of the following could represent ?
a)
b)
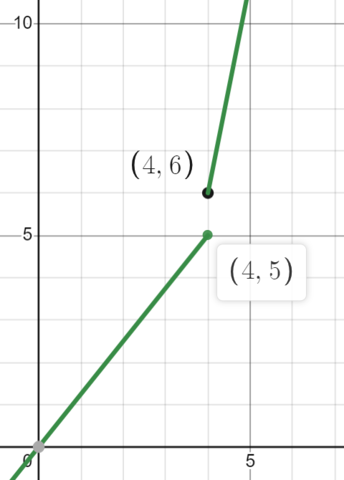
Image Courtesy of Desmos
c)
| 3.8 | 3.9 | 3.999 | 4 | 4.001 | 4.01 | 4.02 | |
| 6.2 | 6.01 | 6.001 | 4 | 4.999 | 4.9 | 4.8 |
✅ Limits Practice Solution
To solve this problem we can look through the answer choices and evaluate the for each one and see if it equals .
First, if we look at the equation in a), we see that we can algebraically manipulate it to be
Since we’re interested in the behavior of the function as approaches 4, we only care about the part of the function where .
Plugging in gets us , so a) is the correct answer.
To confirm that a) is the correct answer, we can look at both the graph in b) and the table in c).
We see that while the graph in b) depicts approaching as approaches from the left, approaches and not as approaches from the right. Therefore, b) is not the correct answer.
From the table in c), we see that for values approaching on the left, approaches , and for values approaching on the right, approaches . Since only one side approaches , is not equal to .
Therefore, a) is the correct answer.
⭐ Closing
Nice work! This key topic is really all about combining what you’re learned so far about limits. On the AP, they’ll likely ask you to do this more than practicing the skills individually.
Key Terms to Review (13)
Algebraic Representation
: An algebraic representation is a mathematical expression or equation that uses variables, constants, and operations to represent relationships between quantities.Approximation
: An approximation is an estimate or close value that is not exact but provides a reasonable representation of something. It involves finding values that are close enough to be useful while acknowledging some degree of error.Computer Programs
: Computer programs are sets of instructions that tell a computer what to do. They are written in programming languages and can perform various tasks, from simple calculations to complex operations.Conjugates
: Conjugates are pairs of complex numbers or algebraic expressions that have the same real part but opposite signs for their imaginary parts. In algebra, conjugates are often used in rationalizing denominators or simplifying radical expressions.Denominator
: The denominator is the bottom part of a fraction that represents the total number of equal parts into which a whole is divided.Exact Solution
: An exact solution refers to finding precise and accurate values for unknowns or variables in mathematical equations or problems. It involves obtaining an answer that satisfies all the given conditions without any approximation.Factoring
: Factoring is the process of breaking down a mathematical expression into its simplest form by finding its factors. It involves identifying common factors and using distributive property to simplify the expression.Function
: A relationship between two sets where each input (domain) value corresponds to exactly one output (range) value.Khan Academy
: Khan Academy is an online educational platform that offers free video lessons, practice exercises, and personalized learning tools for various subjects, including AP Calculus. It provides comprehensive resources to help students understand and master different concepts.Limits
: Limits are used in calculus to describe the behavior of a function as it approaches a certain value or point. It helps determine what happens to the output of a function when the input gets closer and closer to a specific value.Plotting the function on a graph
: Plotting the function on a graph refers to representing a mathematical equation or relationship visually by marking points on a coordinate plane. It helps visualize how the function behaves and identify important features such as intercepts, maxima, minima, and asymptotes.x Approaches a Specific Value
: When we say "x approaches a specific value," it means that the variable x gets arbitrarily close to that particular value without actually reaching it.y-value
: The y-value, also known as the dependent variable, is the value of a function that corresponds to a specific x-value. It represents the output or result of the function.1.9 Connecting Multiple Representations of Limits
6 min read•february 15, 2024
Throughout this unit, we’ve learned how to determine (or estimate) limits from different kinds of representations, including graphs, tables, and algebraic expressions. In this topic, we’ll practice connecting these various representations.
📈Connecting Multiple Representations of Limits
To connect the numerical, graphical, and algebraic representations of limits, we have to be able to gain information from each representation individually and then figure out how the information corresponds or corroborates with each other. This will allow us to gain a more complete understanding of the behavior of the function as x approaches the limit.
For example, we can use the numerical representation to approximate the limit, and then confirm our answer by observing the graphical representation and/or determining the exact limit using the algebraic representation. Or vice versa! 🔂
An important point to note is that sometimes one representation may be more informative than the others. For example, a function that is difficult to manipulate algebraically can be graphed to understand the behavior of the function as x approaches the limit.
Here’s a quick review of each of these:
- 🔢 Numerical Representation - This is the most common method used to determine limits and involves plugging in different values of x that are close to the limit and seeing what the approaches. This data is presented in a table and gives us an approximation of the limit, not the exact solution.
- 📊 Graphical Representation - This method involves and observing the behavior of the as x approaches the limit. This method is also not an exact solution.
- 📝 Algebraic Representation - This involves using algebraic manipulation to determine the exact solution for the limit. With this, you may factor, rationalize denominators, or work with trig!
Now let’s give a question a try!
✏️ Multiple Representations of Limits: Walkthrough
Let be a function where . Which of the following could represent ?
Option A)
Image Courtesy of Desmos
Note: The graph has a removable discontinuity at . We’ll talk about this more in the next key topic.
Option B)
| -0.2 | -0.1 | -0.001 | 0.001 | 0.1 | 0.2 | |
| 1.04 | 1.01 | 1.000001 | 1.000001 | 1.01 | 1.04 |
Option C)
How can we tackle this problem? Well, we can look through the different options and evaluate the for each one and see if it equals . You essentially want to act like each option is on its own so you don’t get distracted by the others! 👀
📈 First, let’s take a look at the graph in a). We see that approaches as approaches from the left, but approaches and as approaches from the right. Therefore, a) is not the correct answer.
🔢 Next, if we look at the table in b), we see that as the values of approach on both the left and right sides, the values of approach , so the function depicted in b) could represent .
🤔 To confirm that b) is the correct answer, we can look at the function given in c). For values approaching on the left we see that approaches or , and for values approaching on the right we see that is . Since only one side approaches , is not equal to .
Therefore, b) is the correct answer.
📝 Limits Practice Problem
Now it’s time for you to do some practice on your own! 🔍
❓Limits Practice Question
Let be a function where . Which of the following could represent ?
a)
b)
Image Courtesy of Desmos
c)
| 3.8 | 3.9 | 3.999 | 4 | 4.001 | 4.01 | 4.02 | |
| 6.2 | 6.01 | 6.001 | 4 | 4.999 | 4.9 | 4.8 |
✅ Limits Practice Solution
To solve this problem we can look through the answer choices and evaluate the for each one and see if it equals .
First, if we look at the equation in a), we see that we can algebraically manipulate it to be
Since we’re interested in the behavior of the function as approaches 4, we only care about the part of the function where .
Plugging in gets us , so a) is the correct answer.
To confirm that a) is the correct answer, we can look at both the graph in b) and the table in c).
We see that while the graph in b) depicts approaching as approaches from the left, approaches and not as approaches from the right. Therefore, b) is not the correct answer.
From the table in c), we see that for values approaching on the left, approaches , and for values approaching on the right, approaches . Since only one side approaches , is not equal to .
Therefore, a) is the correct answer.
⭐ Closing
Nice work! This key topic is really all about combining what you’re learned so far about limits. On the AP, they’ll likely ask you to do this more than practicing the skills individually.
Key Terms to Review (13)
Algebraic Representation
: An algebraic representation is a mathematical expression or equation that uses variables, constants, and operations to represent relationships between quantities.Approximation
: An approximation is an estimate or close value that is not exact but provides a reasonable representation of something. It involves finding values that are close enough to be useful while acknowledging some degree of error.Computer Programs
: Computer programs are sets of instructions that tell a computer what to do. They are written in programming languages and can perform various tasks, from simple calculations to complex operations.Conjugates
: Conjugates are pairs of complex numbers or algebraic expressions that have the same real part but opposite signs for their imaginary parts. In algebra, conjugates are often used in rationalizing denominators or simplifying radical expressions.Denominator
: The denominator is the bottom part of a fraction that represents the total number of equal parts into which a whole is divided.Exact Solution
: An exact solution refers to finding precise and accurate values for unknowns or variables in mathematical equations or problems. It involves obtaining an answer that satisfies all the given conditions without any approximation.Factoring
: Factoring is the process of breaking down a mathematical expression into its simplest form by finding its factors. It involves identifying common factors and using distributive property to simplify the expression.Function
: A relationship between two sets where each input (domain) value corresponds to exactly one output (range) value.Khan Academy
: Khan Academy is an online educational platform that offers free video lessons, practice exercises, and personalized learning tools for various subjects, including AP Calculus. It provides comprehensive resources to help students understand and master different concepts.Limits
: Limits are used in calculus to describe the behavior of a function as it approaches a certain value or point. It helps determine what happens to the output of a function when the input gets closer and closer to a specific value.Plotting the function on a graph
: Plotting the function on a graph refers to representing a mathematical equation or relationship visually by marking points on a coordinate plane. It helps visualize how the function behaves and identify important features such as intercepts, maxima, minima, and asymptotes.x Approaches a Specific Value
: When we say "x approaches a specific value," it means that the variable x gets arbitrarily close to that particular value without actually reaching it.y-value
: The y-value, also known as the dependent variable, is the value of a function that corresponds to a specific x-value. It represents the output or result of the function.Resources
© 2024 Fiveable Inc. All rights reserved.
AP® and SAT® are trademarks registered by the College Board, which is not affiliated with, and does not endorse this website.