The Statistics & Probability section of the ACT makes up around 10% of the ACT Math section. Although it may seem daunting at first, through practice with recognizing patterns in these types of questions, you'll be able to answer them with ease! Let's dive in!! 🏊♀️
🧮 ACT Statistics & Probability Topics
There are four main categories included in ACT Statistics and Probability topics.
📝 Data Collection Methods
This section focuses on understanding the ways that data is collecting, and identifying inaccurate ways of collecting data.
📊 Center and Spread
This section focuses on correctly calculating and interpreting median, mode, mean, and range, as well as choosing which best summarizes and captures the data.
📈 Bivariate Data
This section focuses on being able to understand visual representations of bivariate data, as well as understanding correlation between two variables.
🎲Simple Probabilities and Calculations
This section is about calculating simple probabilities from scenarios and interpreting them to fit the situation.
📝 Data Collection Methods
There are two main types of data collected:
Qualitative Data
🍦 Qualitative data is data that focuses on subjective qualities. For example, collecting data on the most popular ice cream flavors among teenagers. Since the data is based on preferences, and cannot be summarized by numbers, it is considered qualitative.
Quantitative Data
📏 Quantitative data is data that is collected in numerical quantities. For example, collecting data on the average height of students in a high school.
There are also two different types of quantitative data that can be collected.
-
- 👠 discrete data- this is data that only has specific number options. Ex. collecting data on shoe sizes, where 7.333 or 8.0009 are not options. There are only a few specific numbers that are used to describe shoe sizes.
-
- ⚖️ continuous data- this is data where every possible number in an interval can be considered a data point. Ex. collecting data on weight, where 200 lbs or 127.752 lbs are both possible responses.
How Data Can be Collected
There are several ways that data can be collected. Some of the most common methods covered are:
-
- 📑 surveys and censuses- these are studies where a sample of people are asked specific questions usually to gain insight about a population. A census is an example of a population-wide survey.
-
- 👀 observational studies- these are studies that observe the effects of a certain treatment on a sample to establish a correlation.
-
- 🔬 experiments- these are studies that look at effects of a treatment to establish a cause and effect relationship.
A good sample in a study should...
-
- have an appropriate size proportional to the population
-
- be representative of the population
-
- be randomized
🔮 Hypotheses
A hypothesis is a prediction made about the outcome of a study.
There are two main types of hypotheses
-
- 🚫 The null hypothesis (H0)- this hypothesis claims no significant relationship between variables.
-
- 🤝 The alternative hypothesis (Ha)- this hypothesis predicts some significant relationship between variables.
Let's look at some examples 🤠
-
- 🚫 Null hypothesis: There is no relationship between height and age amongst children.
-
- 🤝 Alternative hypothesis: There is a relationship between height and age amongst children.
-
- 🚫 Null hypothesis: There is no relationship between temperature 🔥 and number of ice cream cones sold daily.
-
- 🤝 Alternative hypothesis: The higher the temperature 🔥, the more ice cream cones sold in a day.
🤷♂️ What do we do with a hypothesis?
Hypotheses are usually established before a study is conducted... so what's the next step?
Significance level
-
- After writing your hypothesis, ⍺ or the significance level must be established.
-
- The significance level represents the chance of claiming there is a relationship between variables when there really is not.
-
- The significance level is a measure how confident you have to be in your results before deciding to reject the null hypothesis.
-
- The lower the significance level, the more confident you want to be that your conclusion is accurate.- - Ex. a significance level of 0.07 means that there is a 7% chance you are claiming there is a relationship between variables when there really is not.- - Throughout this study, the goal would be to get results that have a 7% chance or less of making this false claim.
P-Value
-
- A p-value is a value you get after the data is collected.
-
- The p-value measures the chance that you would have gotten the same data given there really is no relationship between variables.
-
- The lower the p-value, the higher the chance that there is a relationship between variables.- - A p-value falls between 0 and 1, where 1 represents a 100% chance there is no relationship between variables.- - A very common p value used is 0.05.
P-Value and Significance Level
-
- If the p-value calculated is equal to or less than the significance level, the null hypothesis can be rejected. This concludes that there is not no relationship between variables.
-
- If the calculated p-value is greater than the significance level, the null hypothesis cannot be rejected.
Let's look at some examples 🥳
-
- ⍺= 0.05 and p= 0.07- - Cannot reject the null hypothesis; p>⍺
-
- ⍺= 0.01 and p=0.01- - Can reject the null hypothesis; p= ⍺
-
- ⍺= 0.07 and p= 0.06- - Can reject the null hypothesis; p<⍺
-----
⌦ Errors
This section covers some of the issues that can affect the accuracy of results in a study.
Bias
Bias is any factor that could influence the data so that it does not accurately represent the reality of its population.
-
- Some common types of bias include:- - ❌ Nonresponse bias- - ❓Response bias- - ⛱ Under-coverage bias
-
- ❌ Nonresponse bias- this is bias that occurs when certain people choose not to respond to questions on a survey. For example, if a survey is being conducted on grade-point averages in a high school, people with lower GPA's would be less likely to respond. These would make the average GPA seem higher based on the survey, even when it is not so high in real life.
-
- ❓Response bias- this is bias resulting from the way a question is written, which can influence the way people respond. It can also be bias that results from people intentionally answering a question dishonestly.
-
- ⛱ Under-coverage bias- this is bias that happens when a sample does not accurately cover the population. For example, if you are conducting a study on how Americans do their grocery shopping, and only sample people who live in Kentucky, the results will not be accurate in representing all of the United States.
Solutions for Bias
Bias can often be minimized 🤏 by...
-
- sampling a larger group of people 👭
-
- including a more diverse group of people in the sample 🌍
-
- adjusting questions to be more subjective 🔎
-
- increasing anonymity of a survey 🎭
False Positives and Negatives
❎ False Positive
-
- This is when a researcher states that something is true when it is actually false.- - Ex. Someone could take a flu test and the test might show that they do have the flu 🤒, even though they actually do not 😊
-
- False positives can also be referred to as type I errors and are represented by ⍺.
☑️ False Negatives
-
- This is when a research states that something is false when it is actually true.- - Ex. Someone takes a blood pressure test that tells them they do not have high blood pressure, even though they do have high blood pressure. 💉
-
- False negatives can also be referred to as type II errors.
-
- The rate of occurrence of type II errors is also referred to as β, or beta.
🌟 Inaccurate results can have dangerous impacts, especially in science and healthcare.

Image Courtesy of University of Hawai'i at Mānoa..)
💪 Power
-
- Power is how likely a certain test is to not produce a false negative result.
-
- The equation to determine power is 1-β
-
- A test with a higher power is considered a more accurate test than one with a low power.
-
- Power can be increased by...- - increasing sample size- - increasing significance level
💡 Tips and Tricks
-
- Always read 📖 through the full question-- especially if there's a scenario given.
-
- Underline key numbers, phrases, and vocabulary as you go.
-
- Don't panic 🤯 if there's a word or phrase you're not familiar with! Instead identify those you are familiar with, and use context clues to understand the rest of the question.
-
- If you're unsure... take a guess!! There is no point penalty for answering a question incorrectly on the ACT. If you are completely lost on a question, always try to put something down anyway.- - It's better to have a 20% chance at a correct answer than a 0% chance!! 🎊
Let's Practice!

Image Courtesy of ACT Form 15AA51.
This question asks us to use past data to predict the expected outcomes for a group of 1000 people. We can assume, since the question states that it is a random group of applicants, that the same percentages of success can be applied to this sample. Therefore, we can start by identifying how many people can be expected to pass the written test. This should be 80% of 1000, or 1000(0.8) which equals 800 people. Next, we know that of these 800 people, only 60% can also be expected to pass the driving test. So, we should find 60% of 800, or 800(0.6) which equals 480.
The answer is B) 480
📊 Center and Spread
🎯 Center
There are three main measures that can be used to identify the center of a data set
-
- 😡 Mean- this is the same as taking the average of a data set. Add up all the data values and divide by the number of values added together.- - sum of values/number of values summed- - Ex. Finding the mean of this data set: 24, 9, 0, 0, 56, 9, 12, -7- - First, I will sum the values in the set: (24+9+0+0+56+9+12+(-7)) = 103- - Next, I will count the total number of terms in the set. Remember to include repeated numbers and zero values!! I count 8 total terms- - Lastly, I will divide the sum from step one by 8: 103/8 = 12.875. Therefore the mean of this data set is 12.875- - Mean can also be represented with the Greek letter μ (mu)
-
- 👫 Median- this is a process used to find the literal middle value in a data set.- - Arrange data points from smallest to largest by value.- - Cross off the smallest and largest values, then the second smallest and second largest etc. until you reach one or two values in the middle.- - If there is only one value, this is the median! If there are two values, average these two values together. Ta-da!🎉- - If a data set only has an even number of values, you will always end up with two values in the middle.- - Ex. Finding the median of this data set: 30, 7, 89, 18, 4- - Ordering values: 4, 7, 18, 30, 89- - Crossing off values- - 4, 7, 18, 30, 89- - 4, 7, 18, 30, 89- - 4, 7, 18, 30, 89- - The median value of the data set is 18.
-
- 🏋️♂️ Mode- this process is used to find the data value that appears most often in a set of data.
-
- ⭐️ Not all data sets will have a mode, and some will have more than one mode.- - Count the number of times each value appears in a set of data.- - Whichever value appears most frequently is the mode!- - Ex. Finding the mode of this data set: 9, 4, 7, 9, 10, 15, 7, 8, 4, 9, 9, 18- - First, we can count how many times each number appears- - 9: four times, 4: two times, 7: two times, 10: one time, 15: one time, 8: one time, 18: one time- - Since 9 appears the most of any other number in the set, 9 is the mode.
🌤Advantages and Disadvantages
😡 Mean
-
- The mean is a good way to identify the center of a data set if there are no strong skews or outliers.- - A skew or outlier in a data set will pull the mean in the direction of the skew.- - Example- - 1, 6, 3, 5, 2, 7, 566 --> the mean will be much higher in value than the actual representative middle of the data because 566 is an outlier- - Looking only at the mean of this set, we would have an inaccurate view of the data.
👫 Median
-
- The median is a consistent way to identify the center of data even with strong skews and outliers.
-
- One downside is that the median is more difficult to find and can leave out the impact of outlier data points.- - Example- - -56, -9, 0, 1, 1, 2, 3, 3, 3, 4, 7, 7, 45, 67, 89, 100, 2578, 99785- - The median of this data set is 3.5, however, this median does not show us the reality of how wide-ranging the data is
⭐️ When a data set is perfectly symmetrical and normal, the mean and median will have the same value.
Spread 🍯
The spread of a data set is a measure of the data's variability, or how varied the values in the data set are.
-
- Examples- - A data set with high variability: -957, -350, -312, -177, -94, -84, -73, -20, 0, 1, 35, 52, 77, 100, 644, 981- - A data set with low variability: -1, -0.5, -0.25, -0.1, 0, 0.2, 0.333, 0.6, 0.8, 1, 2, 2.5
The most common measures of variability and spread are
-
- 🏌️♀️ Range- this is found by subtracting the smallest number in a data set from the largest number.- - The more variability, the larger the range value.- - Examples- - Range of this data set: 3, 4, 73, 95- - 95 - 3 = 92- - Range of this data set: -4, 9, 16, 22- - 22 - (-4) = 22 + 4 = 26
-
- 🔢 Interquartile Range (IQR) - this is a type of range calculated between medians in a data set.- - First, find the median of the data set.- - Next, divide the data set in two with the median as the center. Find the median of the upper and lower halves of the data.- - Subtract the median of the lower half from the median of the upper.- - Example- - IQR of this data set: 19, 23, 24, 26, 29, 33, 34,- - First, the median of this set is 26- - Next, we can find the median of the upper and lower halves. These are called quartile 1 (lower median) and quartile 3 (upper median)- - Upper Half: 26, 29, 33, 34,- - Median is 31- - Lower Half: 19, 23, 24, 26- - Median is 23.5- - The Interquartile range is 31 - 23.5 = 7.5- - Interquartile range is often used to create box and whisker plots 😸

Image Courtesy of Statistics Canada.
-
- 🤼♀️ Standard Deviation- this is the average difference of data points from the mean.
-
- The greater the standard deviation, the greater the variability of the data.
-
- Otherwise said, the further apart all of the data points are, the greater the standard deviation.- - Standard deviation is also represented by σ (sigma).
⭐️ You will not have to calculate the standard deviation on the ACT!! You will just have to be familiar with what it means. If you are curious though, you can check out this link! 😊
💡Tips and Tricks
-
- Many of you may already be familiar with the concepts covered in this category, so it's especially important to make sure you are paying attention to detail to avoid making little mistakes!! 🤸♀️
-
- Practice, practice, practice, practice, practice!! If you're having a bit of trouble with any of these topics, practice will be your best friend. 👯♂️ By doing practice questions and applying these topics, you'll be even more familiar with them for when you do take the real test! 🎉 💪 🤩
With that being said....
Let's Practice!

Image Courtesy of Preparing for the ACT Test 2023-2024.
This question asks us to rearrange the z score equation to solve for x. Let's rewrite the equation in terms of x.
z(σ) = x - μ so z(σ) + μ = x
Now we can plug in the given values.
2(6) + 78 = 12 + 78 = 90
Therefore the answer is F) 90
📈 Bivariate Data
Bivariate data is data that compares the effects of two variables on one another.
The two variables are
-
- Dependent variable- This variable represents an effect. It is usually represented by the y variable.
-
- Independent variable- This variable represents a cause. It is usually represented by the x variable.
Let's look at some examples
-
- Amount of ice cream melted (dependent) vs temperature outside (independent)- - Here, the temperature is the cause and the amount of melted ice cream would be the effect.
-
- Person's weight (dependent) vs amount of cheese eaten daily (independent)- - Here, the person's weight could be the effect based on the amount of cheese eaten daily (cause)
📉 Correlation
Correlation is a way of describing a relationship between variables.
Correlation does not equal cause and effect!!!!
There are three main types of possible correlation
-
- Positive correlation (+1)- as one variable increases, so does the other.- - The more gas in a car's tank, the further distance a car can travel.
-
- Negative correlation (-1) - as one variable increases, the other decreases.- - As time spent sleeping in class increases, a student's grade in the class decreases.
-
- No correlation (0)- there is no relationship between variables.- - As the number of penguins increases, there is no effect on the number of croissants sold in a bakery.

Image Courtesy of BYJU's
-
- The correlation coefficient is a number that can be used to describe the correlation between two variables.
-
- Correlation coefficient values range from -1 to 1.- - The closer to -1, the stronger the negative correlation- - The closer to 1, the stronger the positive correlation- - The closer to 0, the higher the likelihood of no correlation.
Let's Do Some Practice 😼💪
A correlation coefficient of 0.33 indicates a ______________ correlation.
A) Weak positive
B) Strong positive
C) Weak negative
Answer: A
Since 0.33 is positive, it is indicative of a positive correlation. However, since 0.33 is closer to 0 than it is to +1, this shows a weak positive correlation.
A correlation coefficient of -0.75 indicates a _______________ correlation.
A) Weak positive
B) Strong negative
C) Weak negative
Answer: B
Since -0.75 is negative, it shows a negative correlation. However, it is closer to -1 than it is to 0, showing a strong negative correlation.
✨ Tips and Tricks
-
- Come up with a way for yourself to easily remember the meanings of a correlation coefficient and positive vs negative correlation.- - You can even try quickly scribbling down your memory device on the paper to get it off your mind so you can refer back to it later!
-
- Practice identifying correlation based on graphs! Many of the ACT questions on correlation could include graphs, so it's important to be familiar with them.
🎊 More Practice!

Image Courtesy of Varsity Tutors.
First, let's read through the question and establish what we know. We already know that a correlation coefficient of 1.0 shows a strong positive correlation between the two variables, but not a cause and effect relationship. Now, we can look through the answer choices and identify which is not correct. We have already established that the association is positive, so we know it is not the first answer. We also know that correlation is measure on a scale from -1 to +1, so we can cross off the second choice as well. We also see that there is a strong correlation due to the coefficient of 1, so we can eliminate answer three. The fourth answer however, says that one variable causes another. Correlation and causation are not the same. Causation cannot be assumed from correlation or a correlation coefficient.
So, the answer should be the fourth choice.
🎲 Simple Probabilities and Calculations
Standard Probability♟
Probability is a way to calculate how likely something is to happen, often expressed as a percentage or fraction.
It involves placing the outcome you want to focus on as the numerator, and the total number of outcomes as the denominator.
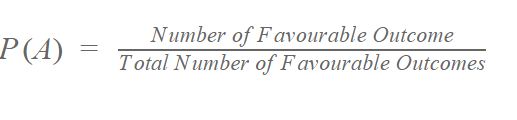
Image Courtesy of BYJU's.
Let's look at a simple example!! 🥳
If I have a bag of 10 blue marbles, 4 green marbles, and 3 yellow marbles, what is the probability of drawing a yellow marble?
-
- First, add up the total number of marbles in the bag. (10 + 4 + 3 = 17)
-
- Next, consider the total amount of yellow marbles in the bag. (3)
-
- Create a fraction with the "object you want to find probability for" over the "total amount of options"- - 3/17 is the final probability of selecting a yellow marble.
"And vs Or" Probability
-
- "And" probability questions ask you to find the probability of one outcome AND another outcome.- - In these questions, you have to multiply the probability of both outcomes.- - Let's see an example- - On a pizza with 14 slices, 8 slices have pineapple, 10 slices have sardines, and 3 slices have olives. What is the chance you pick a slice of pizza with pineapple and sardines? 🍕- - First we need to find the probability of randomly picking a slice with pineapple and the probability of picking a slice with sardines.- - Pineapple: 8/14- - Sardines: 10/14- - Next, we have to multiply these two probabilities together ((8 x 10)/ (14 x 14)) = 80/196 = ~40.81% chance of selecting a sardine and pineapple slice of pizza! 🍍 🐟
-
- "Or" probability questions ask you to find the probability of one outcome OR another outcome occurring.- - In these questions, you have to add the probability of both outcomes.- - Let's look at an example- - In a mixed variety pack of potato chips, 8 of the bags are barbecue flavored, 3 are sour cream and onion flavored, and 6 are ketchup flavored. What is the chance you randomly pick a bag of ketchup or barbecue flavored chips?- - First we need to find the probability of selecting barbecue chips and ketchup chips separately.- - Barbecue: 8/17- - Ketchup: 6/17- - Next, we have to add these two probabilities together. (8 + 6) / 17 = ~82.4% chance of selecting barbecue or ketchup chips! 🥔
-
- Let's see some more examples
-
- A teacher is teaching a class. 👩🏫 They put 8 popsicle sticks, each with a different student's name written on it, in a bag. The teacher draws a stick every time there is an opportunity for participation in class. Every stick has an equal chance of being drawn. After a student's stick is drawn, it is put immediately back in the bag.
-
- What is the probability that the teacher draws Helen's name five times in a row?
-
- First, we need to determine the probability of the event happening once. In this case, the 'event' is Helen's name being drawn from the bag. The probability is 1/8.
-
- Since we want to know the probability of Helen being chosen 5 times, we need to put this probability to the fifth power- - (1/8) x (1/8) x (1/8) x (1/8) x (1/8) represents the chance that Helen is chosen the first time AND the second time AND the third time, and so on. This uses the same strategy as standard probability- - Writing out this process can be time-consuming, so instead we can do: (1/8) ^ 5- - Therefore, we can conclude there is a 0.0031% chance of Helen being chosen five times in a row!
-
- Let's imagine the same situation as before, but this time the teacher takes a stick out of the bag every time a student is chosen. 🧒
-
- What is the probability that the teacher will choose Liam, Robert, and Helen in exactly that order?
-
- First, we need to determine the probability of choosing Liam first. In this case, it is (1/8). This is because there are 8 total sticks in the bag, and only one Liam.
-
- However, what happens once we select one person and take the stick out of the bag? There are now 7 total sticks in the bag.- - Now, what is the probability of selecting Robert? The new probability would be 1/7.
-
- The same pattern continues each time a boy is selected.- - The final probability will be:- - (1/8) x (1/7) x (1/6) = 0.3% chance of selecting Liam, Robert, and Helen in a row!
🍡 Combinations and Permutations
What are combinations and permutations?
-
- Combinations are a group of events where the order the events does not matter
-
- Permutations are groups of events where the order of the events does matter.- - Repeating permutations occur when the same event can happen multiple times
-
- When answering combination and permutation questions, we are aiming to find how many different ways we can create the same group.
Calculating Probabilities
Permutations
-
- Repeating Permutations- - These are permutations where the same event can happen more than once.- - Let's say you want to know how many possible password combinations there are for your 6-digit smartphone passcode.- - In a phone password, the same digit can be used over and over again. This makes it a repeating permutation.- - First, find the number of possibilities for the first digit. In this case it's 0-9, so 10 number options.- - There are 10 possibilities for the second, third, fourth, fifth, and sixth digits as well.- - Next, multiply the number of possible options by the amount of spaces we want to fill. In this case:- - 10 x 10 x 10 x 10 x 10 x 10 = (10)^6 = 1,000,000 possible password permutations.- - Another way to write this is using n and r, where- - n is the number of possible options- - r is the number of spaces- - Total permutations = n^r
-
- Non-repeating Permutations- - These are permutations where the same event cannot happen more than once.- - Let's say a new brand of phone was released, where the same number cannot be used more than once in a password.- - How many permutations of passcodes would there be?- - Let's follow the same process as before.- - First, we need to find the number of possibilities for the first digit. In this case, it is still 10.- - Next, let's find the number of options for the second digit. Since one number has already been used in the first digit of the passcode, we are left with only 9 options.- - Let's see how many options we have for the third digit. Since 2 numbers have been used, there are only 8 number options left.- - This continues all the way to the sixth digit- - So, the number of permutations is: (10 x 9 x 8 x 7 x 6 x 5) = 151,200 possible password permutations- - However, this mathematical process can be tiring-- especially if there are many more options.- - Another way to approach this is to use factorials.- - A factorial multiplies a number by every other number below it until it reaches zero.- - **There is one exception, since the factorial of 0 is 1.- - A factorial is written as a number with an exclamation point- - 3! = 3 x 2 x 1- - Another way we could write the process for this problem is 10!/(10-6)! or 10/4!- - That's the same as (10 x 9 x 8 x 7 x 6 x 5 x 4 x 3 x 2 x 1) / (4 x 3 x 2 x 1) = (10 x 9 x 8 x 7 x 6 x 5) which equals 151,200- - This is the equation for non-repeating permutations:

Image Courtesy of Math is Fun.
Combinations
-
- Repeating Combinations- - In repeating combination questions, the order of events does not matter, and each event can also happen multiple times.- - Let's start by looking at the equation.

Image Courtesy of Math is Fun.
-
- Let's say I'm at the grocery store, and I need to buy 2 cartons of milk. 🐮
-
- There are 4 different options of milk in the store:- - Low-Fat Milk 🥛- - Almond Milk 🌱- - Soy Milk 🍃- - Full-Fat Milk 🐄
-
- I can buy any combination of milk I want to: two low-fat milk cartons, one soy carton with one almond carton, etc.
-
- What are all the possible combinations of milk I can buy?- - In this case- - r is 2 because I need 2 milk cartons- - n is 4 because there are 4 milk options in the store.- - So I can do- - (2 + 4 - 1)! / (2! (4 - 1)!)- - 5!/(2! x 3!)- - (5 x 4 x 3 x 2 x 1)/ (2 x 1 x 3 x 2 x 1)- - (5 x 4 x 3 x 2 x 1)/ (4 x 3 x 1)- - (5 x 4 x 3 x 2 x 1)/ (4 x 3 x 1)- - (5 x 2) = 10.- - Therefore, there are 10 possible combinations of milk I could buy!
-
- Non-repeating Combinations- - In non-repeating combinations, the order of items does not matter, but they cannot be repeated.- - Let's take a look at the equation:

Image Courtesy of Math is Fun.
-
- Let's use another scenario. In this case, I am making a smoothie.
-
- I want to be healthy, so I plan on adding 5 fruits and vegetables to my smoothie. 🍉
-
- I have a total of 7 fruits and vegetables in my fridge:- - Strawberries 🍓- - Corn 🌽- - Banana 🍌- - Pineapple 🍍- - Mango 🥭- - Cucumber 🥒- - Lemon 🍋
-
- I will only be adding each produce item once; I don't want any ingredient to overpower the others!
-
- How many possible smoothie combinations are there?- - n in this case is 7 because I have 7 fruits and veggies to pick from- - r is 5, because I only have space for 5 of these items in the smoothie.- - (7!)/ ((5!) x (7-5)!)- - 7!/ (5! x 2!)- - (7 x 6 x 5 x 4 x 3 x 2 x 1) / (5 x 4 x 3 x 2 x 1 x 2 x 1)- - (7 x 6 x 5 x 4 x 3 x 2 x 1)/ (5 x 4 x 3 x 4 x 1)- - (7 x 6 x 5 x 4 x 3 x 2 x 1)/ (5 x 4 x 3 x 4 x 1)- - (7 x 6 x 2)/ 4- - 84/4- - 21 possible smoothie combinations!! 😋
Tips and Tricks! ⭐️
-
- Get familiar with going through the same processes and using the equations, especially using your calculator!
-
- Try to use the same type of calculator to study as you plan to use on the test.
-
- Don't feel overwhelmed if a problem seems complex at first glance. Read through the question and break it down into smaller chunks to make it easier to solve.
Let's Do Some Practice!

Image Courtesy of Preparing for the ACT Test 2023-2024.
First, we can identify what type of question this is.
In this case, it is a non-repeating permutation problem. This is because she cannot pick the same plant twice, but the number of plants she has to choose from decreases each time.
Next, let's identify our r and n values.
Emily has 6 plants to choose from, so n=6. There are 3 spots she can put the plants in, so r= 3
Now, let's plug into the equation and solve.
6!/(6-3!)) = 6!/3! = (6 x 5 x 4 x 3 x 2 x 1)/ (3 x 2 x 1) = 6 x 5 x 4 = 120
**Therefore, the correct answer is D) 120
😎 Conclusion
You've made it to the end of this guide, and you're one step closer to crushing the Math ACT!!! 🤩
Remember-- you've got this!! 💪
Good luck! 🍀 🌈