Standard Deviation
4 min read•november 23, 2021
William
William
Standard Deviation
Welcome to yet another lesson immersed in the world of data and interpretations, statisticians! There are many parts in a thorough explanation for a graph or chart, including mean, median, variance, and much more! This lesson will highlight the spread of the data, otherwise known as the standard deviation! 👏
Let’s get started! 🚀
What is Standard Deviation?
The standard deviation helps discover how varied the data in a data set is. Not only does it enable statisticians to interpret the distribution of the data better, but it also helps them identify other features related to the mean and median of the data. In other words, standard deviation helps explain parts of the data for specific numbers like the mean. 😳
Here are a couple of quick vocab words for you to crunch on as we explore these concepts deeper! 🖐
Distribution: an interpretation of the spread of data when the data is displayed visually.
Standard Deviation: an interpretation of data distribution either from a data set or as a whole.
Population Standard Deviation: standard deviation capturing the entirety of the data set.
Sample Standard Deviation: standard deviation ONLY for certain parts of the data set (AKA a sample).
⭐ FUN FACT: In an informal context, the standard deviation might be considered a unit that you could use to identify the typical distance between any data set's value from the mean of the data. |
Exploring the Standard Deviation
Let’s take a look at the distribution of data to explore the idea of standard deviation further! 🚀
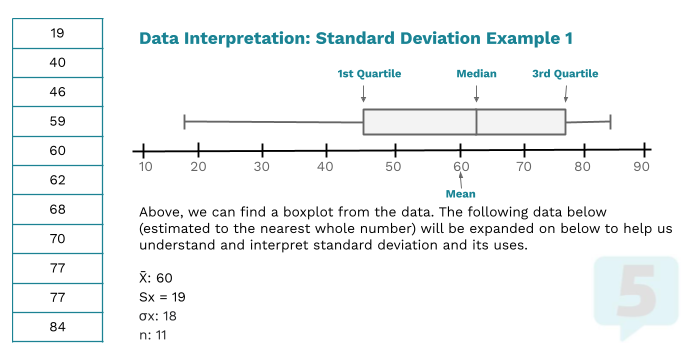
The standard deviation values in the image above are derived from the data on the left side. Assuming that the information on the left captures all of the data in the set, we should use σx, or "sigma x," which provides the value for the standard deviation of all data from the set. This means that the typical distance between the mean and a value in the data set (in "units" of standard deviations) is about 19 SDs! 😅
⭐ Fun Fact: The mean and the standard deviation work hand in hand, which contrasts from the median and the IQR, which work hand in hand also. You can explore more on this topic with the article on Summary Statistics! |
When to Use the Standard Deviation
Since the mean and the standard deviation work hand in hand, the data would be captured as a whole. As an interpreter of the data, statisticians need to discover features of the graph that represent the data most accurately as a whole! ✍️
If there are any outliers, unusual features, or skewness, statisticians typically use the median and the IQR to interpret the distribution. 🤯 If there were an outlier, the mean and standard deviation would change since they reflect the data as a whole! Therefore, statisticians don't want to have an outlier or any other unusual feature influence the interpretation of the distribution. 🙈
In all other cases, the mean and the standard deviation can be the methods of interpreting the graph's distribution and the overall spread of data! ✅
✎ Interested in learning more about standard deviation, and even exploring a concept called z-scores? Check out an article on The Normal Distribution from Fiveable for more details about the usefulness of standard deviation! |
Standard Deviation on Your Calculator
It's always easier to have a calculator do a lot of the work for you! As long as you know the concepts behind the calculations, interpretation, and purpose of the standard deviation, simplifying the process is typical for statisticians, especially when handling hefty masses of data. 💪
Let's try this with your graphing calculator! It works on several versions, including the TI-83 and TI-84, but your calculator might not have these features in its program if it's an older calculator. 😢
STAT (left of the blue arrows)
1:EDIT (first choice on the screen)
Enter data into the lists feature!
Click STAT again
Calc (Use blue arrows to go one over to the right)
1:1-Var Stats (first choice on the screen under the “CALC” module)
If you have an older operating system, you may need to click 2ND + [List Number] (e.g. 2ND + 1 calls the list L3) to produce the appropriate list.
Interpreting Calculator Results
When identifying the standard deviation, you may not know what some of the abbreviations mean on a TI calculator when determining the standard deviation! While the calculator will also produce all of the information about a data set, including things beyond the standard deviation, here are a couple of quick variables for you to know related to standard deviation!
X̄ (x-bar): Calculates the mean
σx (sigma x): population standard deviation
n: sample size
What to Take Away
Standard deviation helps statisticians identify and interpret the spread of either a part of a data set or data as a whole. With the standard deviation, statisticians can successfully interpret another aspect of data with another measure of data in their toolbox. Good luck with your studies, and see you next time! 🌊
🤝Connect with other students studying Statistics with Hours!
Standard Deviation
4 min read•november 23, 2021
William
William
Standard Deviation
Welcome to yet another lesson immersed in the world of data and interpretations, statisticians! There are many parts in a thorough explanation for a graph or chart, including mean, median, variance, and much more! This lesson will highlight the spread of the data, otherwise known as the standard deviation! 👏
Let’s get started! 🚀
What is Standard Deviation?
The standard deviation helps discover how varied the data in a data set is. Not only does it enable statisticians to interpret the distribution of the data better, but it also helps them identify other features related to the mean and median of the data. In other words, standard deviation helps explain parts of the data for specific numbers like the mean. 😳
Here are a couple of quick vocab words for you to crunch on as we explore these concepts deeper! 🖐
Distribution: an interpretation of the spread of data when the data is displayed visually.
Standard Deviation: an interpretation of data distribution either from a data set or as a whole.
Population Standard Deviation: standard deviation capturing the entirety of the data set.
Sample Standard Deviation: standard deviation ONLY for certain parts of the data set (AKA a sample).
⭐ FUN FACT: In an informal context, the standard deviation might be considered a unit that you could use to identify the typical distance between any data set's value from the mean of the data. |
Exploring the Standard Deviation
Let’s take a look at the distribution of data to explore the idea of standard deviation further! 🚀
The standard deviation values in the image above are derived from the data on the left side. Assuming that the information on the left captures all of the data in the set, we should use σx, or "sigma x," which provides the value for the standard deviation of all data from the set. This means that the typical distance between the mean and a value in the data set (in "units" of standard deviations) is about 19 SDs! 😅
⭐ Fun Fact: The mean and the standard deviation work hand in hand, which contrasts from the median and the IQR, which work hand in hand also. You can explore more on this topic with the article on Summary Statistics! |
When to Use the Standard Deviation
Since the mean and the standard deviation work hand in hand, the data would be captured as a whole. As an interpreter of the data, statisticians need to discover features of the graph that represent the data most accurately as a whole! ✍️
If there are any outliers, unusual features, or skewness, statisticians typically use the median and the IQR to interpret the distribution. 🤯 If there were an outlier, the mean and standard deviation would change since they reflect the data as a whole! Therefore, statisticians don't want to have an outlier or any other unusual feature influence the interpretation of the distribution. 🙈
In all other cases, the mean and the standard deviation can be the methods of interpreting the graph's distribution and the overall spread of data! ✅
✎ Interested in learning more about standard deviation, and even exploring a concept called z-scores? Check out an article on The Normal Distribution from Fiveable for more details about the usefulness of standard deviation! |
Standard Deviation on Your Calculator
It's always easier to have a calculator do a lot of the work for you! As long as you know the concepts behind the calculations, interpretation, and purpose of the standard deviation, simplifying the process is typical for statisticians, especially when handling hefty masses of data. 💪
Let's try this with your graphing calculator! It works on several versions, including the TI-83 and TI-84, but your calculator might not have these features in its program if it's an older calculator. 😢
STAT (left of the blue arrows)
1:EDIT (first choice on the screen)
Enter data into the lists feature!
Click STAT again
Calc (Use blue arrows to go one over to the right)
1:1-Var Stats (first choice on the screen under the “CALC” module)
If you have an older operating system, you may need to click 2ND + [List Number] (e.g. 2ND + 1 calls the list L3) to produce the appropriate list.
Interpreting Calculator Results
When identifying the standard deviation, you may not know what some of the abbreviations mean on a TI calculator when determining the standard deviation! While the calculator will also produce all of the information about a data set, including things beyond the standard deviation, here are a couple of quick variables for you to know related to standard deviation!
X̄ (x-bar): Calculates the mean
σx (sigma x): population standard deviation
n: sample size
What to Take Away
Standard deviation helps statisticians identify and interpret the spread of either a part of a data set or data as a whole. With the standard deviation, statisticians can successfully interpret another aspect of data with another measure of data in their toolbox. Good luck with your studies, and see you next time! 🌊
🤝Connect with other students studying Statistics with Hours!
Resources
© 2024 Fiveable Inc. All rights reserved.
AP® and SAT® are trademarks registered by the College Board, which is not affiliated with, and does not endorse this website.