9.5 Carrying Out a Test for the Slope of a Regression Model
5 min read•january 8, 2023
Josh Argo
Jed Quiaoit
Josh Argo
Jed Quiaoit
As we finished out on Section 9.4, we have set up the test for slope of a regression model, now we have to calculate our test statistics and make our conclusion. 🔥
If the assumptions of a linear regression model are satisfied and the null hypothesis is true, the distribution of the slope estimate is a t-distribution. Specifically, the slope estimate follows a t-distribution with n-2 degrees of freedom, where n is the sample size. This follows from the Central Limit Theorem and the fact that the slope estimate is a linear combination of the observations.
T-Score
The first thing we need to calculate is our critical value (or t-score). Our t-score can tell us how far away from the mean (null slope value) our sample is, so it gives us a scale to see how close our sample is to the expected slope value. ⛰️
The formula to compute our t-score is similar to any other critical value. We must take our observed value, subtract the expected value and then divide the result by the standard deviation.
t = (b - β)/SE of b
In this case, we are going to base our t-score off of our degrees of freedom being n-2. When there is only one parameter we are testing, we will use n-1 as our degrees of freedom.
P-Value
The next, and most important statistic that we need to calculate is the p-value. Our p-value is the probability that our particular slope occurs if we assume the null slope (usually 0). 🚗
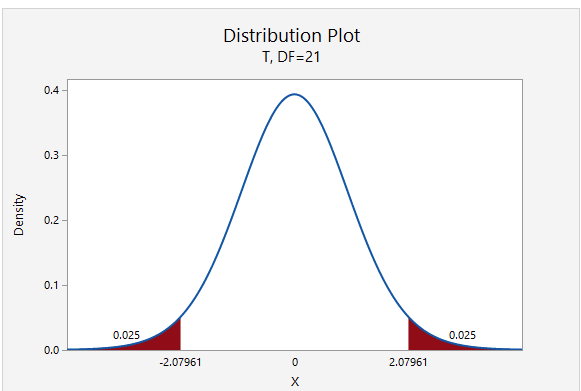
In the example above, our t score came out to be 2.0791 with 21 degrees of freedom. Therefore, since we are performing a two-tailed test, our p-value comes out to be 0.5 (typically your t score and p-value don’t come out to be exactly our significance level). Therefore, there is approximately a 5% chance of obtaining our given sample, assuming that the null slope of 0 is true. A 5% chance of something happening by random chance is pretty low, therefore, we would reject our null hypothesis in favor of the alternate due to the evidence from our sample.
Concluding Your Test and Response Templates
Once you have your t-score and p-value from your calculations, you are ready to conclude your test. As in with any other inference procedure you have performed, your conclusion is primarily based on your p-value that was obtained from your t-distribution and t-score. 🎆
If the p is lower than your significance level:
"Since our p value is less than our significance level, we reject our Ho. We have significant evidence that the true slope of the regression line between ________ and ______ is (value in alternate hypothesis, usually not 0)."
If the p is not lower than your significance level:
"Since our p value is more than our significance level, we fail to reject our Ho. We do not have significant evidence that the true slope of the regression line between ________ and ______ is (value in alternate hypothesis, usually not 0)."
For more practice on this concept and to see a problem worked through completely, move on to Section 9.6!
Practice Problem
You are a researcher studying the relationship between income and happiness. You collect data on income and happiness scores for a sample of 50 individuals. You want to test whether there is a statistically significant linear relationship between these two variables. 😀
You decide to use a t-test for the slope of the regression line to test the following null and alternative hypotheses:
H0: There is no linear relationship between income and happiness (i.e., the slope of the regression line is equal to 0).
Ha: There is a linear relationship between income and happiness (i.e., the slope of the regression line is not equal to 0).
You compute the t-statistic for the slope and find that it has a value of 2.5. The degrees of freedom for the t-distribution are 48 (since the sample size is 50 and there are two variables).
Based on the t-statistic and the degrees of freedom, you compute the p-value for the test. The p-value is the probability of obtaining a t-statistic as extreme as or more extreme than the observed t-statistic, given that the null hypothesis is true.
After performing the t-test, you find that the p-value is 0.01. You use a significance level of 0.05.
What is your conclusion about the null hypothesis? Explain your reasoning.
Answer
In this case, the p-value of 0.01 is less than the significance level of 0.05, so you would reject the null hypothesis that there is no linear relationship between income and happiness. This indicates that there is sufficient evidence to support the alternative hypothesis that there is a linear relationship between these two variables.
Your reasoning for rejecting the null hypothesis would be based on the fact that the p-value is less than the significance level. The p-value represents the probability of obtaining a t-statistic as extreme as or more extreme than the observed t-statistic, given that the null hypothesis is true. If this probability is low, it suggests that the observed t-statistic is unlikely to have occurred by chance, and therefore the null hypothesis is likely to be false. In this case, the low p-value of 0.01 indicates that the observed t-statistic of 2.5 is unlikely to have occurred by chance, and therefore the null hypothesis should be rejected.
🎥 Watch: AP Stats Unit 9 - Inference for Slopes
Key Terms to Review (12)
Alternative Hypothesis
: The alternative hypothesis is a statement that contradicts or negates the null hypothesis. It suggests that there is a significant relationship or difference between variables.Central Limit Theorem
: The Central Limit Theorem states that as the sample size increases, the sampling distribution of the mean approaches a normal distribution regardless of the shape of the population distribution.Degrees of Freedom
: Degrees of freedom refers to the number of values in a calculation that are free to vary. In statistics, it represents the number of independent pieces of information available for estimating a parameter.Null Hypothesis
: The null hypothesis is a statement of no effect or relationship between variables in a statistical analysis. It assumes that any observed differences or associations are due to random chance.P-value
: The p-value is a probability value that helps determine whether an observed result is statistically significant or occurred by chance. It quantifies how strong or weak evidence against a null hypothesis exists.Regression Model
: A regression model is a statistical tool used to examine the relationship between a dependent variable and one or more independent variables. It helps us understand how changes in the independent variables affect the dependent variable.Significance Level
: The significance level, also known as alpha (α), determines how much evidence we need to reject the null hypothesis. It represents the probability of making a Type I error.Standard Deviation
: The standard deviation measures the average amount of variation or dispersion in a set of data. It tells us how spread out the values are from the mean.t-Distribution
: The t-distribution is a probability distribution that is used in statistical inference for small sample sizes or when the population standard deviation is unknown. It is similar to the normal distribution but has thicker tails.t-score
: A t-score is a statistical measure that represents how far a sample mean deviates from the population mean, in terms of standard error units. It is used to determine if there is a significant difference between the sample and population means.T-test for the Slope of the Regression Line
: The t-test for the slope of the regression line assesses whether there is sufficient evidence to conclude that there is a linear relationship between two variables in regression analysis.Test Statistics
: Test statistics are numerical measures used to make decisions about hypotheses in statistical hypothesis testing. They quantify how far our sample data deviates from what we would expect under certain assumptions.9.5 Carrying Out a Test for the Slope of a Regression Model
5 min read•january 8, 2023
Josh Argo
Jed Quiaoit
Josh Argo
Jed Quiaoit
As we finished out on Section 9.4, we have set up the test for slope of a regression model, now we have to calculate our test statistics and make our conclusion. 🔥
If the assumptions of a linear regression model are satisfied and the null hypothesis is true, the distribution of the slope estimate is a t-distribution. Specifically, the slope estimate follows a t-distribution with n-2 degrees of freedom, where n is the sample size. This follows from the Central Limit Theorem and the fact that the slope estimate is a linear combination of the observations.
T-Score
The first thing we need to calculate is our critical value (or t-score). Our t-score can tell us how far away from the mean (null slope value) our sample is, so it gives us a scale to see how close our sample is to the expected slope value. ⛰️
The formula to compute our t-score is similar to any other critical value. We must take our observed value, subtract the expected value and then divide the result by the standard deviation.
t = (b - β)/SE of b
In this case, we are going to base our t-score off of our degrees of freedom being n-2. When there is only one parameter we are testing, we will use n-1 as our degrees of freedom.
P-Value
The next, and most important statistic that we need to calculate is the p-value. Our p-value is the probability that our particular slope occurs if we assume the null slope (usually 0). 🚗
In the example above, our t score came out to be 2.0791 with 21 degrees of freedom. Therefore, since we are performing a two-tailed test, our p-value comes out to be 0.5 (typically your t score and p-value don’t come out to be exactly our significance level). Therefore, there is approximately a 5% chance of obtaining our given sample, assuming that the null slope of 0 is true. A 5% chance of something happening by random chance is pretty low, therefore, we would reject our null hypothesis in favor of the alternate due to the evidence from our sample.
Concluding Your Test and Response Templates
Once you have your t-score and p-value from your calculations, you are ready to conclude your test. As in with any other inference procedure you have performed, your conclusion is primarily based on your p-value that was obtained from your t-distribution and t-score. 🎆
If the p is lower than your significance level:
"Since our p value is less than our significance level, we reject our Ho. We have significant evidence that the true slope of the regression line between ________ and ______ is (value in alternate hypothesis, usually not 0)."
If the p is not lower than your significance level:
"Since our p value is more than our significance level, we fail to reject our Ho. We do not have significant evidence that the true slope of the regression line between ________ and ______ is (value in alternate hypothesis, usually not 0)."
For more practice on this concept and to see a problem worked through completely, move on to Section 9.6!
Practice Problem
You are a researcher studying the relationship between income and happiness. You collect data on income and happiness scores for a sample of 50 individuals. You want to test whether there is a statistically significant linear relationship between these two variables. 😀
You decide to use a t-test for the slope of the regression line to test the following null and alternative hypotheses:
H0: There is no linear relationship between income and happiness (i.e., the slope of the regression line is equal to 0).
Ha: There is a linear relationship between income and happiness (i.e., the slope of the regression line is not equal to 0).
You compute the t-statistic for the slope and find that it has a value of 2.5. The degrees of freedom for the t-distribution are 48 (since the sample size is 50 and there are two variables).
Based on the t-statistic and the degrees of freedom, you compute the p-value for the test. The p-value is the probability of obtaining a t-statistic as extreme as or more extreme than the observed t-statistic, given that the null hypothesis is true.
After performing the t-test, you find that the p-value is 0.01. You use a significance level of 0.05.
What is your conclusion about the null hypothesis? Explain your reasoning.
Answer
In this case, the p-value of 0.01 is less than the significance level of 0.05, so you would reject the null hypothesis that there is no linear relationship between income and happiness. This indicates that there is sufficient evidence to support the alternative hypothesis that there is a linear relationship between these two variables.
Your reasoning for rejecting the null hypothesis would be based on the fact that the p-value is less than the significance level. The p-value represents the probability of obtaining a t-statistic as extreme as or more extreme than the observed t-statistic, given that the null hypothesis is true. If this probability is low, it suggests that the observed t-statistic is unlikely to have occurred by chance, and therefore the null hypothesis is likely to be false. In this case, the low p-value of 0.01 indicates that the observed t-statistic of 2.5 is unlikely to have occurred by chance, and therefore the null hypothesis should be rejected.
🎥 Watch: AP Stats Unit 9 - Inference for Slopes
Key Terms to Review (12)
Alternative Hypothesis
: The alternative hypothesis is a statement that contradicts or negates the null hypothesis. It suggests that there is a significant relationship or difference between variables.Central Limit Theorem
: The Central Limit Theorem states that as the sample size increases, the sampling distribution of the mean approaches a normal distribution regardless of the shape of the population distribution.Degrees of Freedom
: Degrees of freedom refers to the number of values in a calculation that are free to vary. In statistics, it represents the number of independent pieces of information available for estimating a parameter.Null Hypothesis
: The null hypothesis is a statement of no effect or relationship between variables in a statistical analysis. It assumes that any observed differences or associations are due to random chance.P-value
: The p-value is a probability value that helps determine whether an observed result is statistically significant or occurred by chance. It quantifies how strong or weak evidence against a null hypothesis exists.Regression Model
: A regression model is a statistical tool used to examine the relationship between a dependent variable and one or more independent variables. It helps us understand how changes in the independent variables affect the dependent variable.Significance Level
: The significance level, also known as alpha (α), determines how much evidence we need to reject the null hypothesis. It represents the probability of making a Type I error.Standard Deviation
: The standard deviation measures the average amount of variation or dispersion in a set of data. It tells us how spread out the values are from the mean.t-Distribution
: The t-distribution is a probability distribution that is used in statistical inference for small sample sizes or when the population standard deviation is unknown. It is similar to the normal distribution but has thicker tails.t-score
: A t-score is a statistical measure that represents how far a sample mean deviates from the population mean, in terms of standard error units. It is used to determine if there is a significant difference between the sample and population means.T-test for the Slope of the Regression Line
: The t-test for the slope of the regression line assesses whether there is sufficient evidence to conclude that there is a linear relationship between two variables in regression analysis.Test Statistics
: Test statistics are numerical measures used to make decisions about hypotheses in statistical hypothesis testing. They quantify how far our sample data deviates from what we would expect under certain assumptions.Resources
© 2024 Fiveable Inc. All rights reserved.
AP® and SAT® are trademarks registered by the College Board, which is not affiliated with, and does not endorse this website.