8.4 Expected Counts in Two Way Tables
2 min read•january 7, 2023
Josh Argo
Jed Quiaoit
Josh Argo
Jed Quiaoit
Tests from Two-Way Tables
Another form of data that we can use χ2 tests for involves data from a two-way table (like the one pictured below). 🎨
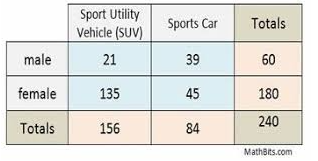
Image Taken from MathBitsNotebook
When performing a χ2 test from a two way table, there are two different tests we may have to perform and choosing which one can be tricky.
Test for Homogeneity
A is used to compare the distribution of a categorical variable between two or more independent groups or populations. It is used to test the null hypothesis that the of the categories are the same in all the groups. In other words, we'll have to use the when we're comparing two different populations and if two different populations have different amounts for a given categorical variable. 🍞
Test for Independence
A is used to examine the relationship between two categorical variables in a single population. It is used to test the null hypothesis that the two variables are independent, meaning that the presence or absence of one variable does not affect the probability of the other variable. In other words, we'll use this test when we're comparing within one population to see if two categorical variables are associated within the one population, we would use a χ2 . 💥
Expected Counts
Regardless of which test we are doing, we will be comparing two multi-row/column matrices rather than just two rows or columns. This means we have to calculate the matrix based off of our observed counts table. This will be done by doing the following for each cell: 😀
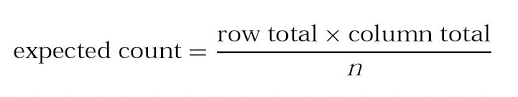
where n = table total.
Example
In the first cell on the two way table above on SUV and sports car ownership in regard to male or female, we would take the total male (60) and the total SUV (156), multiply those to get 9360. Then we would divide that total by our table total (240) and get 39. We would complete this process for all steps to create our expected count table. 🚗
Our final answer would be:
SUV | Sports Car | |
Male | 39 | 21 |
Female | 117 | 63 |
Applications
In the next sections, we will talk about setting up the two types of χ2 tests regarding a two way table and how we will use these observed and to determine if we have association or homogeneity between our two variables/populations. Stay tuned 'til then! 😉
🎥 Watch: AP Stats Unit 8 - Chi Squared Tests
Key Terms to Review (6)
Chi-Squared Test for Homogeneity
: The Chi-Squared Test for Homogeneity compares whether different populations have similar distributions across multiple categories or variables.Chi-Squared Test for Independence
: The Chi-Squared Test for Independence is used to determine if there is a relationship between two categorical variables in a population.Expected Counts
: Expected counts are calculated values that represent what we would expect to observe in each category if there was no association between variables. They are based on assumptions and can be compared to observed counts to assess whether there is a significant relationship.Proportions
: Proportions refer to the relative amount or share of a particular characteristic within a population or sample.Test for Independence
: A statistical test used to determine if there is a relationship between two categorical variables. It assesses whether the occurrence of one variable is independent of the occurrence of another variable.χ2 tests
: χ2 tests, also known as chi-square tests, are statistical tests used to determine if there is a significant association between two categorical variables. It compares the observed frequencies in a sample to the expected frequencies under a null hypothesis.8.4 Expected Counts in Two Way Tables
2 min read•january 7, 2023
Josh Argo
Jed Quiaoit
Josh Argo
Jed Quiaoit
Tests from Two-Way Tables
Another form of data that we can use χ2 tests for involves data from a two-way table (like the one pictured below). 🎨
Image Taken from MathBitsNotebook
When performing a χ2 test from a two way table, there are two different tests we may have to perform and choosing which one can be tricky.
Test for Homogeneity
A is used to compare the distribution of a categorical variable between two or more independent groups or populations. It is used to test the null hypothesis that the of the categories are the same in all the groups. In other words, we'll have to use the when we're comparing two different populations and if two different populations have different amounts for a given categorical variable. 🍞
Test for Independence
A is used to examine the relationship between two categorical variables in a single population. It is used to test the null hypothesis that the two variables are independent, meaning that the presence or absence of one variable does not affect the probability of the other variable. In other words, we'll use this test when we're comparing within one population to see if two categorical variables are associated within the one population, we would use a χ2 . 💥
Expected Counts
Regardless of which test we are doing, we will be comparing two multi-row/column matrices rather than just two rows or columns. This means we have to calculate the matrix based off of our observed counts table. This will be done by doing the following for each cell: 😀
where n = table total.
Example
In the first cell on the two way table above on SUV and sports car ownership in regard to male or female, we would take the total male (60) and the total SUV (156), multiply those to get 9360. Then we would divide that total by our table total (240) and get 39. We would complete this process for all steps to create our expected count table. 🚗
Our final answer would be:
SUV | Sports Car | |
Male | 39 | 21 |
Female | 117 | 63 |
Applications
In the next sections, we will talk about setting up the two types of χ2 tests regarding a two way table and how we will use these observed and to determine if we have association or homogeneity between our two variables/populations. Stay tuned 'til then! 😉
🎥 Watch: AP Stats Unit 8 - Chi Squared Tests
Key Terms to Review (6)
Chi-Squared Test for Homogeneity
: The Chi-Squared Test for Homogeneity compares whether different populations have similar distributions across multiple categories or variables.Chi-Squared Test for Independence
: The Chi-Squared Test for Independence is used to determine if there is a relationship between two categorical variables in a population.Expected Counts
: Expected counts are calculated values that represent what we would expect to observe in each category if there was no association between variables. They are based on assumptions and can be compared to observed counts to assess whether there is a significant relationship.Proportions
: Proportions refer to the relative amount or share of a particular characteristic within a population or sample.Test for Independence
: A statistical test used to determine if there is a relationship between two categorical variables. It assesses whether the occurrence of one variable is independent of the occurrence of another variable.χ2 tests
: χ2 tests, also known as chi-square tests, are statistical tests used to determine if there is a significant association between two categorical variables. It compares the observed frequencies in a sample to the expected frequencies under a null hypothesis.Resources
© 2024 Fiveable Inc. All rights reserved.
AP® and SAT® are trademarks registered by the College Board, which is not affiliated with, and does not endorse this website.