4.12 The Geometric Distribution
5 min read•december 31, 2022
Kanya Shah
Jed Quiaoit
Kanya Shah
Jed Quiaoit
A geometric random variable is a type of discrete random variable that is used to model the number of trials needed to achieve the first success in a sequence of independent trials. Each trial has two possible outcomes: success or failure, with probability p and 1 - p, respectively. The probability distribution of Y is a geometric distribution with probability p of success on any trial, where the possible values of Y are 1, 2, 3, … n. ❤️
For example, suppose you are trying to find the number of coin flips needed to get the first heads. In this case, X is a geometric random variable that represents the number of flips needed to get the first heads. The probability of success (getting a heads) is p = 0.5, and the probability of failure (getting a tails) is 1 - p = 0.5.
Binomial vs. Geometric: Spot the Difference!
Wait, but doesn't the description above look exactly like the set-up for binomial distributions? 😱
Well, the main difference between binomial and geometric random variables is the type of outcome they are used to model.
A binomial random variable is used to model the number of successes in a fixed number of trials
A geometric random variable is used to model the number of trials needed to achieve the first success.
Here are some examples to help illustrate the difference between binomial and geometric random variables:
Situation 1: Flipping a coin 10 times and counting the number of heads
In this example, you are performing a fixed number of trials (10 flips) and counting the number of successes (heads). The random variable X would be a binomial random variable with parameters n = 10 and p = 0.5 (assuming the coin is fair).
Situation 2: Flipping a coin until you get the first heads
In this example, you are performing a sequence of trials (coin flips) until you achieve the first success (heads). The random variable X would be a geometric random variable with probability p = 0.5 (assuming the coin is fair).
Calculating Probabilities
If a random variable Y follows a geometric distribution with probability p of success on each trial, then the possible values of Y are 1, 2, 3, ..., representing the number of trials needed to achieve the first success. To calculate the probability of a specific value k, you can use the probability function of the geometric distribution. The probability mass function of the geometric distribution is given by:
P(Y=k) = (1-p)^(k-1) * p
For example, if Y is a geometric random variable with probability p = 0.5 of success on each trial, then the probability of Y being equal to 3 (that is, the probability of needing 3 trials to achieve the first success) is:
P(Y=3) = (1-p)^(3-1) * p = (1-0.5)^(3-1) * 0.5 = 0.25 * 0.5 = 0.125
You can also use the cumulative distribution function (CDF) or the probability density function (PDF) of the geometric distribution to calculate probabilities. When using technology, the CDF of the geometric distribution (geometricCDF) gives the probability of Y being less than or equal to a specific value k, while the PDF (geometricPDF) gives the probability of Y being equal to a specific value k. 📱
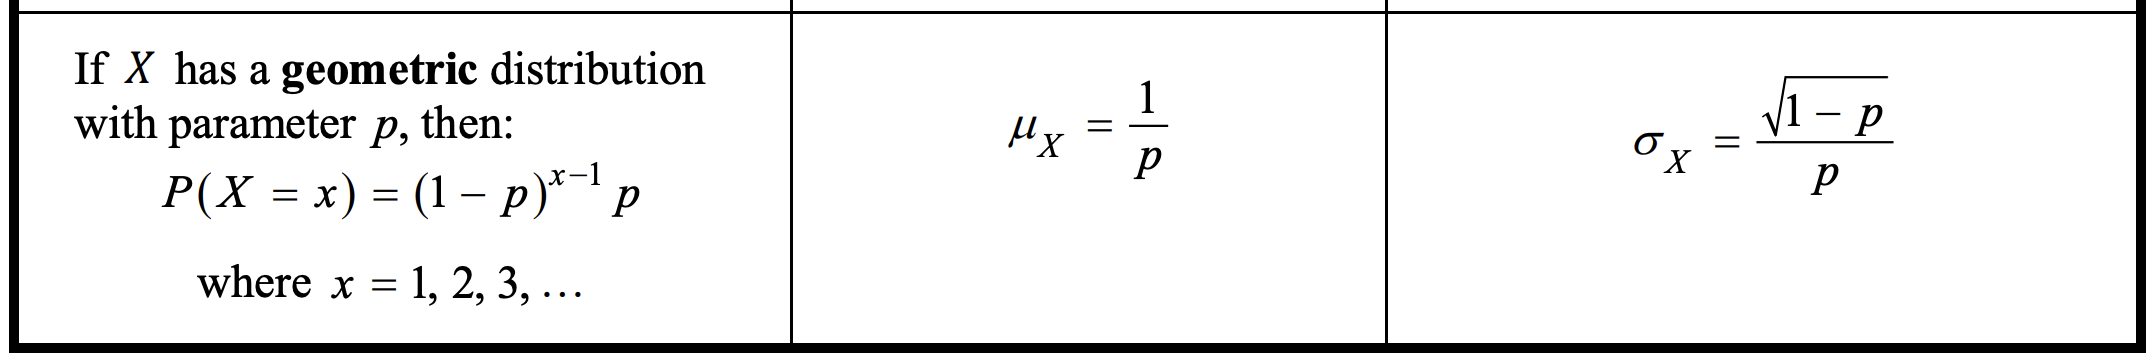
Source: College Board (AP Statistics Formulas and Tables)
Shape, Center, and Variability
The mean and standard deviation of a geometric random variable Y can be calculated using the following formulas:
Mean -- The mean (expected value) of a geometric random variable Y, which represents the number of trials needed to achieve the first success with probability p of success on each trial, is given by: mean = E(Y) = 1/p
Standard deviation -- The standard deviation of a geometric random variable Y, which represents the number of trials needed to achieve the first success with probability p of success on each trial, is given by: standard deviation = σy = sqrt((1-p)/p)
Another interesting thing to note is that every geometric distribution has a skewed right graph, meaning that the graph of the distribution is skewed towards the right side of the mean. This is due to the fact that the geometric random variable can take on only positive integer values, and the probability of success decreases as the number of trials increases. ➡️
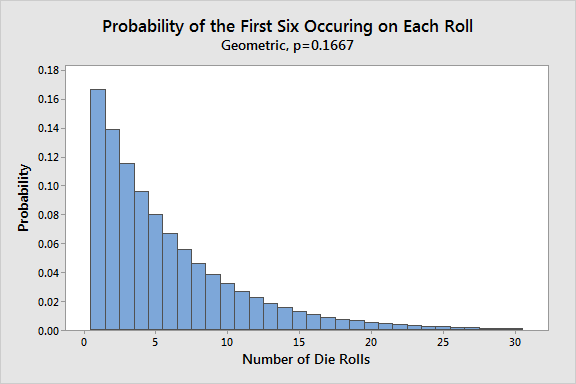
Source: Statistics by Jim
🎥 Watch: AP Stats - Probability: Random Variables, Binomial/Geometric Distributions
Practice Problem
A manufacturing company produces a product that has a 5% defect rate. This means that the probability of a product being defective is p = 0.05. The company wants to know the probability of the first defective product being produced on the 20th unit. What is the probability of the first defective product being produced on the 20th unit? 🤖
Answer
To solve this problem, we can use the probability function of a geometric random variable. The probability function of a geometric random variable gives the probability of the first success occurring on the nth trial, where the probability of success is p.
In this case, Y is a geometric random variable that represents the number of units needed to produce the first defective product. The probability of success (producing a defective product) is p = 0.05, and the probability of failure (producing a non-defective product) is 1 - p = 0.95.
To find the probability of the first defective product being produced on the 20th unit, we can use the probability mass function of the geometric distribution as follows:
P(Y=20) = (1-p)^(20-1) * p
= (1-0.05)^(20-1) * 0.05
= (0.95^19) * 0.05
= 0.0189
Interpretation in Context: This means that the probability of the first defective product being produced on the 20th unit is about 0.0189, or 1.89%.
Key Terms to Review (7)
Binomial Random Variable
: A binomial random variable represents the number of successes in a fixed number of independent Bernoulli trials, where each trial has the same probability of success.Cumulative Distribution Function (CDF)
: The cumulative distribution function (CDF) is a function that gives the probability that a random variable takes on a value less than or equal to a given value.Geometric Distribution
: The geometric distribution is a probability distribution that models the number of trials needed to achieve the first success in a sequence of independent Bernoulli trials, where each trial has the same probability of success.Geometric Random Variable
: A geometric random variable represents the number of trials needed to achieve the first success in a sequence of independent Bernoulli trials, where each trial has a constant probability of success.Probability Mass Function (PMF)
: The PMF is a function that gives us probabilities associated with specific values of discrete random variables. It assigns probabilities to all possible outcomes and satisfies two properties: each probability is between 0 and 1, and the sum of all probabilities is equal to 1.Skewed Right Graph
: A skewed right graph, also known as positively skewed graph, is a distribution where most of the data points are concentrated on lower values with few extreme higher values. It has a long tail on its right side.Standard Deviation
: The standard deviation measures the average amount of variation or dispersion in a set of data. It tells us how spread out the values are from the mean.4.12 The Geometric Distribution
5 min read•december 31, 2022
Kanya Shah
Jed Quiaoit
Kanya Shah
Jed Quiaoit
A geometric random variable is a type of discrete random variable that is used to model the number of trials needed to achieve the first success in a sequence of independent trials. Each trial has two possible outcomes: success or failure, with probability p and 1 - p, respectively. The probability distribution of Y is a geometric distribution with probability p of success on any trial, where the possible values of Y are 1, 2, 3, … n. ❤️
For example, suppose you are trying to find the number of coin flips needed to get the first heads. In this case, X is a geometric random variable that represents the number of flips needed to get the first heads. The probability of success (getting a heads) is p = 0.5, and the probability of failure (getting a tails) is 1 - p = 0.5.
Binomial vs. Geometric: Spot the Difference!
Wait, but doesn't the description above look exactly like the set-up for binomial distributions? 😱
Well, the main difference between binomial and geometric random variables is the type of outcome they are used to model.
A binomial random variable is used to model the number of successes in a fixed number of trials
A geometric random variable is used to model the number of trials needed to achieve the first success.
Here are some examples to help illustrate the difference between binomial and geometric random variables:
Situation 1: Flipping a coin 10 times and counting the number of heads
In this example, you are performing a fixed number of trials (10 flips) and counting the number of successes (heads). The random variable X would be a binomial random variable with parameters n = 10 and p = 0.5 (assuming the coin is fair).
Situation 2: Flipping a coin until you get the first heads
In this example, you are performing a sequence of trials (coin flips) until you achieve the first success (heads). The random variable X would be a geometric random variable with probability p = 0.5 (assuming the coin is fair).
Calculating Probabilities
If a random variable Y follows a geometric distribution with probability p of success on each trial, then the possible values of Y are 1, 2, 3, ..., representing the number of trials needed to achieve the first success. To calculate the probability of a specific value k, you can use the probability function of the geometric distribution. The probability mass function of the geometric distribution is given by:
P(Y=k) = (1-p)^(k-1) * p
For example, if Y is a geometric random variable with probability p = 0.5 of success on each trial, then the probability of Y being equal to 3 (that is, the probability of needing 3 trials to achieve the first success) is:
P(Y=3) = (1-p)^(3-1) * p = (1-0.5)^(3-1) * 0.5 = 0.25 * 0.5 = 0.125
You can also use the cumulative distribution function (CDF) or the probability density function (PDF) of the geometric distribution to calculate probabilities. When using technology, the CDF of the geometric distribution (geometricCDF) gives the probability of Y being less than or equal to a specific value k, while the PDF (geometricPDF) gives the probability of Y being equal to a specific value k. 📱
Source: College Board (AP Statistics Formulas and Tables)
Shape, Center, and Variability
The mean and standard deviation of a geometric random variable Y can be calculated using the following formulas:
Mean -- The mean (expected value) of a geometric random variable Y, which represents the number of trials needed to achieve the first success with probability p of success on each trial, is given by: mean = E(Y) = 1/p
Standard deviation -- The standard deviation of a geometric random variable Y, which represents the number of trials needed to achieve the first success with probability p of success on each trial, is given by: standard deviation = σy = sqrt((1-p)/p)
Another interesting thing to note is that every geometric distribution has a skewed right graph, meaning that the graph of the distribution is skewed towards the right side of the mean. This is due to the fact that the geometric random variable can take on only positive integer values, and the probability of success decreases as the number of trials increases. ➡️
Source: Statistics by Jim
🎥 Watch: AP Stats - Probability: Random Variables, Binomial/Geometric Distributions
Practice Problem
A manufacturing company produces a product that has a 5% defect rate. This means that the probability of a product being defective is p = 0.05. The company wants to know the probability of the first defective product being produced on the 20th unit. What is the probability of the first defective product being produced on the 20th unit? 🤖
Answer
To solve this problem, we can use the probability function of a geometric random variable. The probability function of a geometric random variable gives the probability of the first success occurring on the nth trial, where the probability of success is p.
In this case, Y is a geometric random variable that represents the number of units needed to produce the first defective product. The probability of success (producing a defective product) is p = 0.05, and the probability of failure (producing a non-defective product) is 1 - p = 0.95.
To find the probability of the first defective product being produced on the 20th unit, we can use the probability mass function of the geometric distribution as follows:
P(Y=20) = (1-p)^(20-1) * p
= (1-0.05)^(20-1) * 0.05
= (0.95^19) * 0.05
= 0.0189
Interpretation in Context: This means that the probability of the first defective product being produced on the 20th unit is about 0.0189, or 1.89%.
Key Terms to Review (7)
Binomial Random Variable
: A binomial random variable represents the number of successes in a fixed number of independent Bernoulli trials, where each trial has the same probability of success.Cumulative Distribution Function (CDF)
: The cumulative distribution function (CDF) is a function that gives the probability that a random variable takes on a value less than or equal to a given value.Geometric Distribution
: The geometric distribution is a probability distribution that models the number of trials needed to achieve the first success in a sequence of independent Bernoulli trials, where each trial has the same probability of success.Geometric Random Variable
: A geometric random variable represents the number of trials needed to achieve the first success in a sequence of independent Bernoulli trials, where each trial has a constant probability of success.Probability Mass Function (PMF)
: The PMF is a function that gives us probabilities associated with specific values of discrete random variables. It assigns probabilities to all possible outcomes and satisfies two properties: each probability is between 0 and 1, and the sum of all probabilities is equal to 1.Skewed Right Graph
: A skewed right graph, also known as positively skewed graph, is a distribution where most of the data points are concentrated on lower values with few extreme higher values. It has a long tail on its right side.Standard Deviation
: The standard deviation measures the average amount of variation or dispersion in a set of data. It tells us how spread out the values are from the mean.Resources
© 2024 Fiveable Inc. All rights reserved.
AP® and SAT® are trademarks registered by the College Board, which is not affiliated with, and does not endorse this website.