5.2 The Phillips Curve
3 min read•january 2, 2023
Jeanne Stansak
Haseung Jun
Jeanne Stansak
Haseung Jun
Phillips Curve
The is a graph that shows how inflation rates and unemployment rates are related to each other, both in the short-run and long-run. It is actually just a reflection of the AD/AS graph. In the short-run, there is a between inflation and unemployment.
This graph deals with the twin evils (inflation and unemployment) continue to trade off. Unfortunately, we don't live in a perfect world, so we can never have inflation low and unemployment low at the same. When both are high, it's called , and it happens when the economy is (literally) on the verge of collapsing.
In the short run, inflation and unemployment have an inverse relationship. However, in the long run, unemployment will stay at a natural rate (reflecting the vertical nature of the long run Philips curve). The economy is always operating somewhere along the short-run , while in the long run, unemployment stays at a natural rate. Therefore, the long-run is the intersection of SRPC and LRPC.
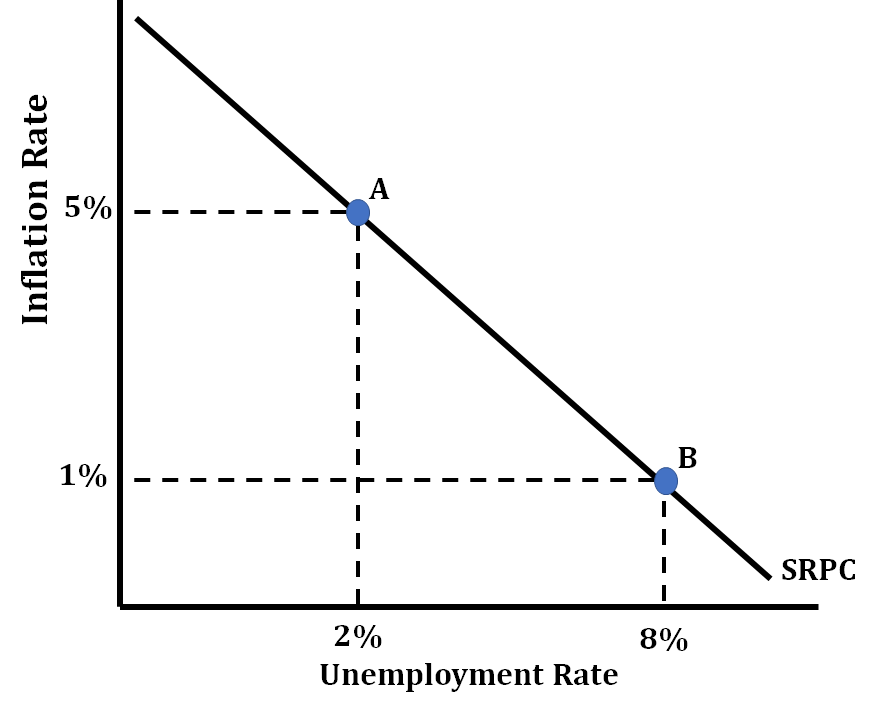
Inflation is low when unemployment is high because fewer people are working, and there is less demand for goods and services. As a result, prices don't rise as fast. When unemployment gets lower, inflation gets higher because so many more people have jobs and the money to spend on things. This means that there is a higher demand for goods and services, which increases prices.
Shifting AD
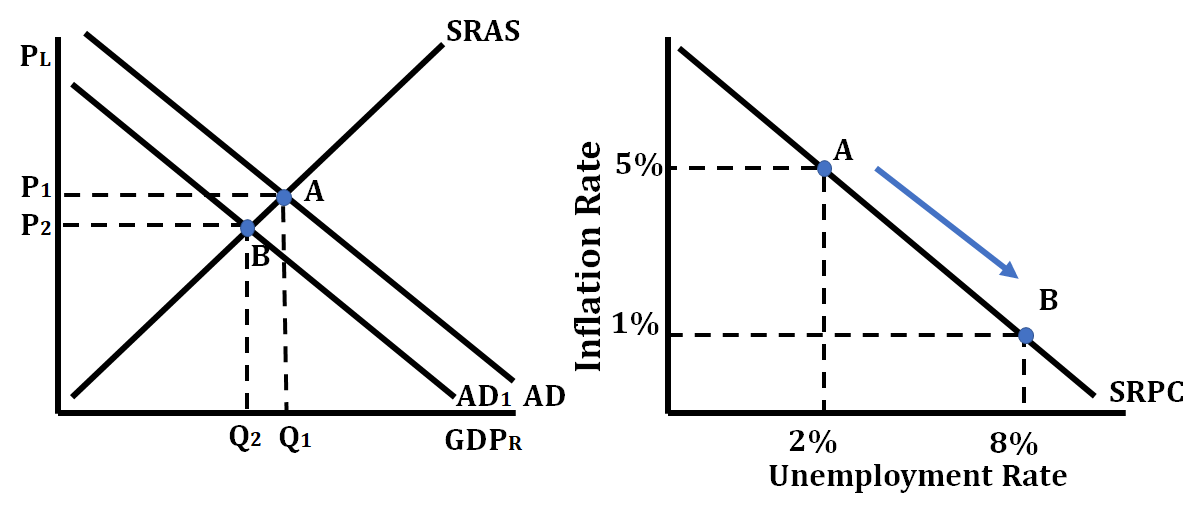
The AS/AD graph and the have a lot in common. In the AS/AD graph, a decrease in AD causes a change in from point A to point B. The same change in AD that causes the price level (PL) to fall and the to fall causes inflation to fall but unemployment to rise. This is mirrored on the short-run with a movement from point A to point B. See graph below.
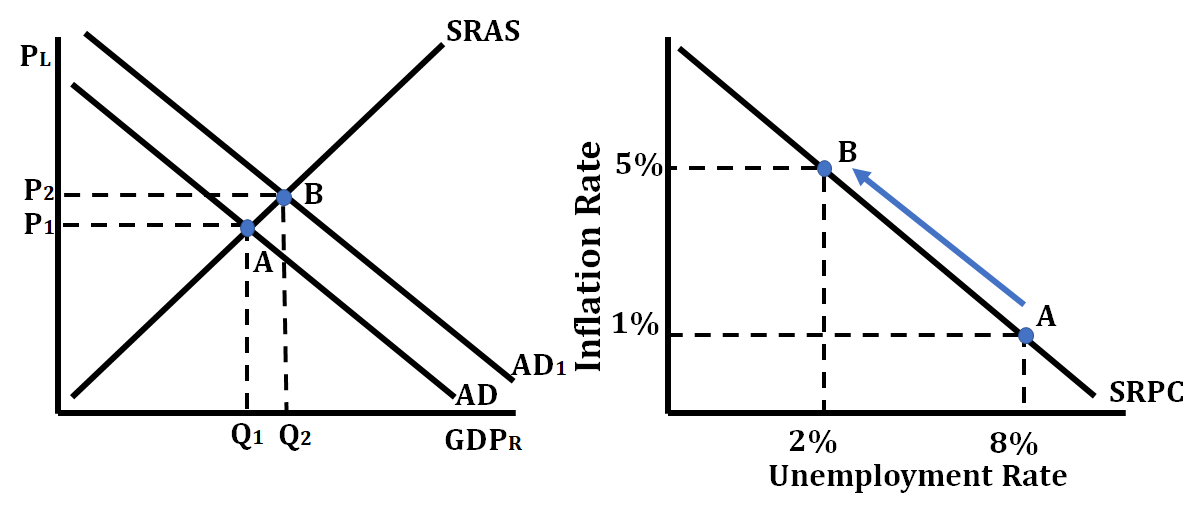
In the AS/AD graph, an increase in AD causes a change in from point A to point B. The same change in AD that causes the price level (PL) to increase and the to increases causes inflation to rise but unemployment to fall. This is mirrored on the short-run with a movement from point A to point B.
Shifting SRAS
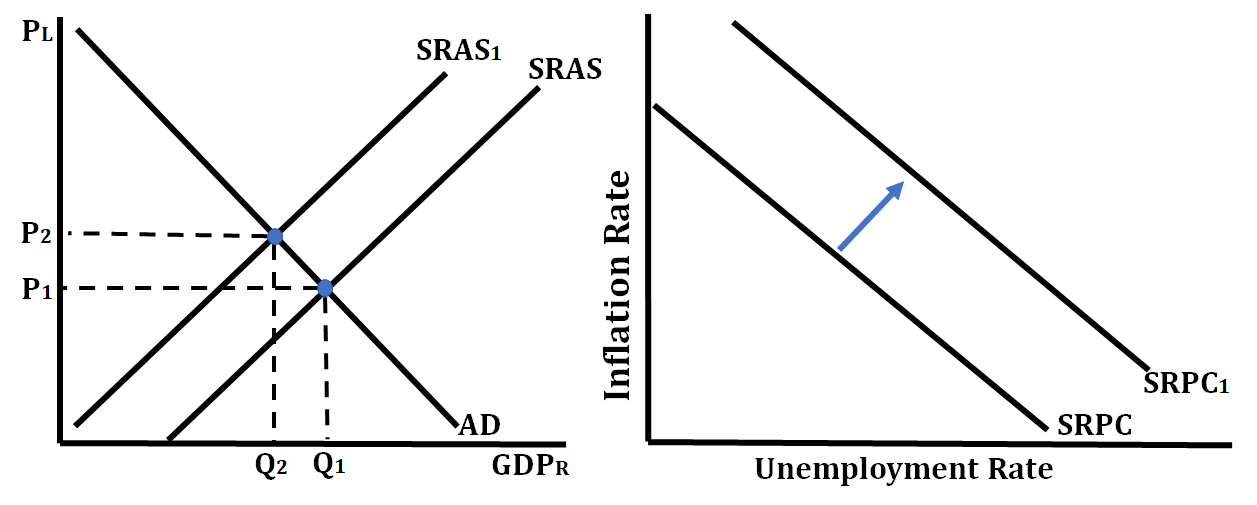
Whenever something makes the SRAS curve shift right or left, the short-run (SRPC) shifts in the opposite direction. If the SRAS curve shifts right, the SRPC will shift left, causing price level (inflation) and unemployment to fall. However, if the SRAS curve shifts left, the SRPC will shift right, indicating because unemployment rate and inflation are both increasing.
In the case of the graph below, an increase in the SRAS curve, a shift to the right of this curve to SRAS1, will result in a leftward shift of the SRPC curve.
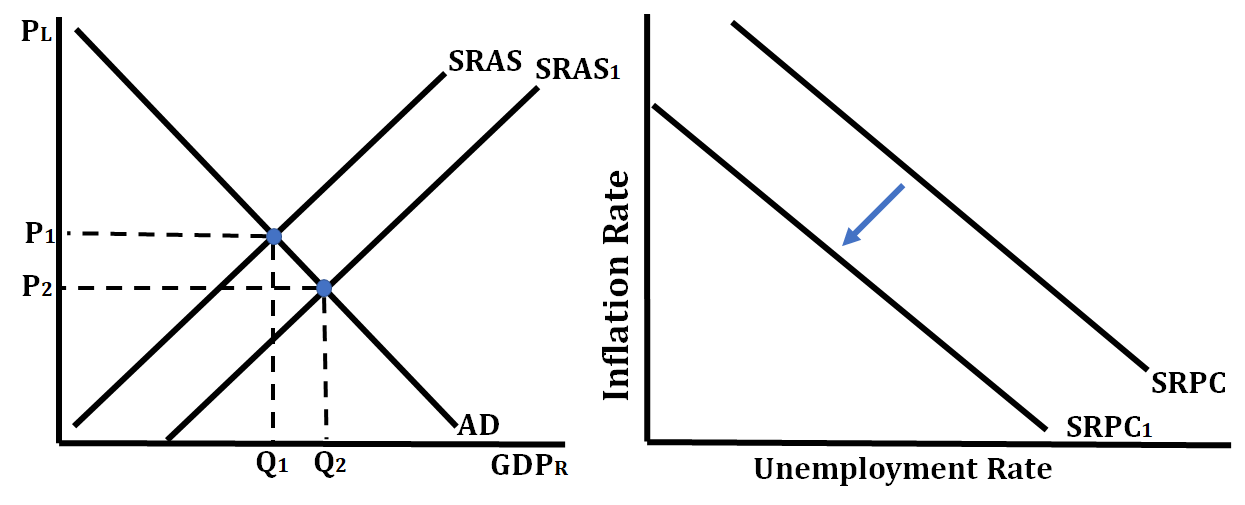
A decrease in the SRAS curve, a shift to the left of this curve, will result in a rightward shift of the SRPC curve.
Long-Run Philips Curve
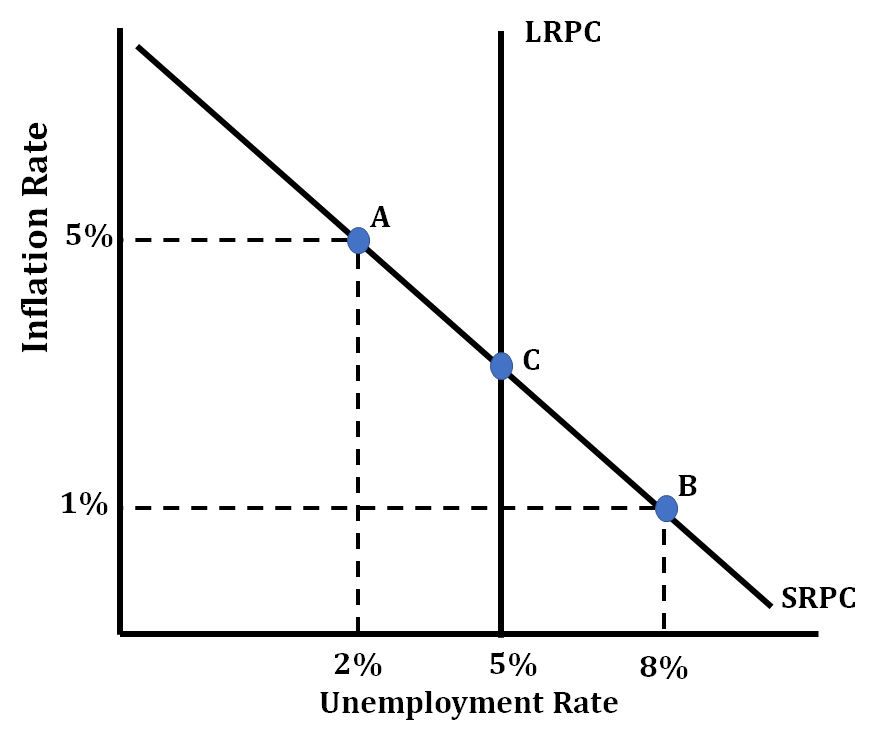
The long-run (LRPC) shows that, in the long-run, there is no between inflation and unemployment. The LRPC exists at an economy's , which just so happens to correspond to and the LRAS. The graph below shows an LRPC at the economy's of 5%. When an economy's changes, so does LRPC. The LRPC tells us that policies to change the level of employment in the economy will ultimately result in only changes in the inflation rate.
Key Terms to Review (15)
Aggregate demand (AD)
: Aggregate demand refers to the total amount of goods and services that all sectors in an economy are willing and able to purchase at different price levels during a given time period.Aggregate Demand-Aggregate Supply (AD/AS) Model
: The AD/AS model is an economic framework used to analyze how changes in aggregate demand and aggregate supply affect overall price levels and real GDP. It shows the relationship between these factors and helps explain short-run fluctuations in the economy.Economic Policies
: Economic policies refer to the actions and decisions made by governments or central banks to influence and manage the economy. These policies are implemented to achieve specific economic goals, such as promoting growth, reducing unemployment, or controlling inflation.Equilibrium
: Equilibrium refers to a state of balance or stability in an economic system where the quantity demanded equals the quantity supplied. It is the point at which there is no tendency for prices or quantities to change.Full Employment
: Full employment is an economic condition where all available labor resources are being used efficiently without any cyclical unemployment present. It occurs when the actual unemployment rate equals the natural rate of unemployment.Long-Run Aggregate Supply (LRAS)
: LRAS represents the total amount of goods and services an economy can produce when all resources are fully utilized, and prices have adjusted to their long-run equilibrium levels. It is a vertical line on the aggregate supply curve.Long-run Phillips curve (LRPC)
: The long-run Phillips curve illustrates that there is no permanent trade-off between inflation and unemployment in the long run. It suggests that any attempt to reduce unemployment below its natural rate will only result in higher inflation.Natural Rate of Unemployment
: The natural rate of unemployment refers to the level of unemployment that exists when the economy is operating at its full potential output. It includes frictional and structural unemployment but excludes cyclical unemployment.Phillips Curve
: The Phillips Curve shows the inverse relationship between unemployment rate and inflation rate. It suggests that as unemployment decreases, inflation tends to increase (and vice versa).Real GDP
: Real GDP refers to the total value of all goods and services produced within a country's borders, adjusted for inflation. It measures the economic output of a nation over a specific period.Shifts in SRPC
: Shifts in the Short-Run Phillips Curve (SRPC) refer to changes in the relationship between inflation and unemployment. These shifts occur when factors such as changes in expectations, supply shocks, or government policies alter the trade-off between inflation and unemployment.Short-run Aggregate Supply (SRAS)
: Short-run aggregate supply represents the total amount of goods and services that firms are willing to produce and sell at different price levels in the short run. It takes into account factors such as input prices, wages, and productivity.Short-run Phillips curve (SRPC)
: The short-run Phillips curve represents the inverse relationship between the unemployment rate and the inflation rate in the short run. As unemployment decreases, inflation tends to increase, and vice versa.Stagflation
: Stagflation refers to a situation where an economy experiences both high inflation and high unemployment simultaneously, which is contradictory to the traditional Phillips curve relationship between inflation and unemployment.Trade-off
: A trade-off refers to the decision-making process of giving up one thing in order to gain something else. It involves making choices because resources are limited and individuals or societies cannot have everything they want.5.2 The Phillips Curve
3 min read•january 2, 2023
Jeanne Stansak
Haseung Jun
Jeanne Stansak
Haseung Jun
Phillips Curve
The is a graph that shows how inflation rates and unemployment rates are related to each other, both in the short-run and long-run. It is actually just a reflection of the AD/AS graph. In the short-run, there is a between inflation and unemployment.
This graph deals with the twin evils (inflation and unemployment) continue to trade off. Unfortunately, we don't live in a perfect world, so we can never have inflation low and unemployment low at the same. When both are high, it's called , and it happens when the economy is (literally) on the verge of collapsing.
In the short run, inflation and unemployment have an inverse relationship. However, in the long run, unemployment will stay at a natural rate (reflecting the vertical nature of the long run Philips curve). The economy is always operating somewhere along the short-run , while in the long run, unemployment stays at a natural rate. Therefore, the long-run is the intersection of SRPC and LRPC.
Inflation is low when unemployment is high because fewer people are working, and there is less demand for goods and services. As a result, prices don't rise as fast. When unemployment gets lower, inflation gets higher because so many more people have jobs and the money to spend on things. This means that there is a higher demand for goods and services, which increases prices.
Shifting AD
The AS/AD graph and the have a lot in common. In the AS/AD graph, a decrease in AD causes a change in from point A to point B. The same change in AD that causes the price level (PL) to fall and the to fall causes inflation to fall but unemployment to rise. This is mirrored on the short-run with a movement from point A to point B. See graph below.
In the AS/AD graph, an increase in AD causes a change in from point A to point B. The same change in AD that causes the price level (PL) to increase and the to increases causes inflation to rise but unemployment to fall. This is mirrored on the short-run with a movement from point A to point B.
Shifting SRAS
Whenever something makes the SRAS curve shift right or left, the short-run (SRPC) shifts in the opposite direction. If the SRAS curve shifts right, the SRPC will shift left, causing price level (inflation) and unemployment to fall. However, if the SRAS curve shifts left, the SRPC will shift right, indicating because unemployment rate and inflation are both increasing.
In the case of the graph below, an increase in the SRAS curve, a shift to the right of this curve to SRAS1, will result in a leftward shift of the SRPC curve.
A decrease in the SRAS curve, a shift to the left of this curve, will result in a rightward shift of the SRPC curve.
Long-Run Philips Curve
The long-run (LRPC) shows that, in the long-run, there is no between inflation and unemployment. The LRPC exists at an economy's , which just so happens to correspond to and the LRAS. The graph below shows an LRPC at the economy's of 5%. When an economy's changes, so does LRPC. The LRPC tells us that policies to change the level of employment in the economy will ultimately result in only changes in the inflation rate.
Key Terms to Review (15)
Aggregate demand (AD)
: Aggregate demand refers to the total amount of goods and services that all sectors in an economy are willing and able to purchase at different price levels during a given time period.Aggregate Demand-Aggregate Supply (AD/AS) Model
: The AD/AS model is an economic framework used to analyze how changes in aggregate demand and aggregate supply affect overall price levels and real GDP. It shows the relationship between these factors and helps explain short-run fluctuations in the economy.Economic Policies
: Economic policies refer to the actions and decisions made by governments or central banks to influence and manage the economy. These policies are implemented to achieve specific economic goals, such as promoting growth, reducing unemployment, or controlling inflation.Equilibrium
: Equilibrium refers to a state of balance or stability in an economic system where the quantity demanded equals the quantity supplied. It is the point at which there is no tendency for prices or quantities to change.Full Employment
: Full employment is an economic condition where all available labor resources are being used efficiently without any cyclical unemployment present. It occurs when the actual unemployment rate equals the natural rate of unemployment.Long-Run Aggregate Supply (LRAS)
: LRAS represents the total amount of goods and services an economy can produce when all resources are fully utilized, and prices have adjusted to their long-run equilibrium levels. It is a vertical line on the aggregate supply curve.Long-run Phillips curve (LRPC)
: The long-run Phillips curve illustrates that there is no permanent trade-off between inflation and unemployment in the long run. It suggests that any attempt to reduce unemployment below its natural rate will only result in higher inflation.Natural Rate of Unemployment
: The natural rate of unemployment refers to the level of unemployment that exists when the economy is operating at its full potential output. It includes frictional and structural unemployment but excludes cyclical unemployment.Phillips Curve
: The Phillips Curve shows the inverse relationship between unemployment rate and inflation rate. It suggests that as unemployment decreases, inflation tends to increase (and vice versa).Real GDP
: Real GDP refers to the total value of all goods and services produced within a country's borders, adjusted for inflation. It measures the economic output of a nation over a specific period.Shifts in SRPC
: Shifts in the Short-Run Phillips Curve (SRPC) refer to changes in the relationship between inflation and unemployment. These shifts occur when factors such as changes in expectations, supply shocks, or government policies alter the trade-off between inflation and unemployment.Short-run Aggregate Supply (SRAS)
: Short-run aggregate supply represents the total amount of goods and services that firms are willing to produce and sell at different price levels in the short run. It takes into account factors such as input prices, wages, and productivity.Short-run Phillips curve (SRPC)
: The short-run Phillips curve represents the inverse relationship between the unemployment rate and the inflation rate in the short run. As unemployment decreases, inflation tends to increase, and vice versa.Stagflation
: Stagflation refers to a situation where an economy experiences both high inflation and high unemployment simultaneously, which is contradictory to the traditional Phillips curve relationship between inflation and unemployment.Trade-off
: A trade-off refers to the decision-making process of giving up one thing in order to gain something else. It involves making choices because resources are limited and individuals or societies cannot have everything they want.Resources
© 2024 Fiveable Inc. All rights reserved.
AP® and SAT® are trademarks registered by the College Board, which is not affiliated with, and does not endorse this website.