1.1 Introduction to Maps and Types of Maps
8 min read•january 2, 2023
Sana Fatah
Riya Patel
Sana Fatah
Riya Patel
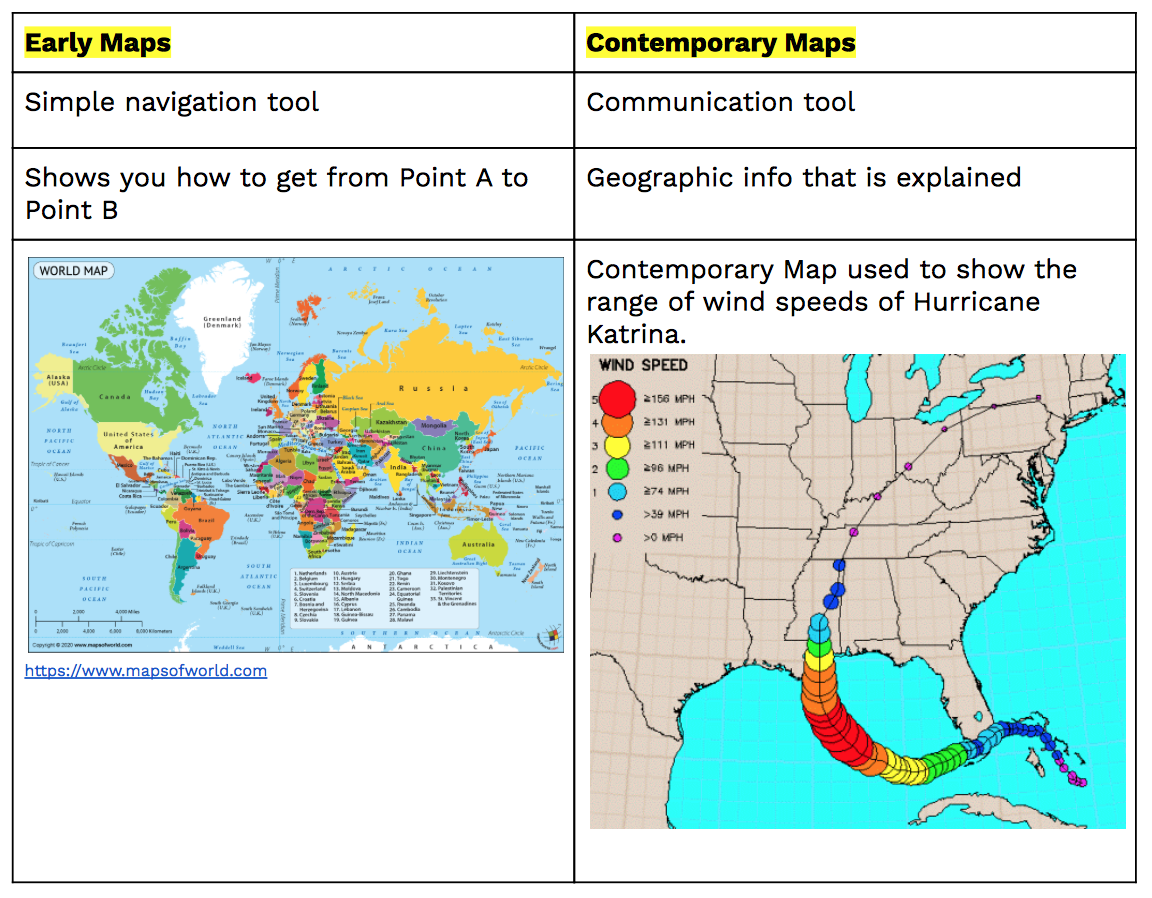
Early Maps vs Contemporary Maps
Map Scale and Projection
Have you ever seen a map the size of America? Or the size of the world? No? Then how are maps accurate if they are not the same size as the area they are representing? That’s where scaling comes into play.
A is a way to represent the relationship between distances on a map and the actual distances on the ground.
Map scales can vary greatly, depending on the size and purpose of the map. Large-scale maps, such as those used for city or street maps, have a small scale and show a lot of detail. Small-scale maps, such as world or regional maps, have a large scale and show less detail but cover a larger area.
Map scales are an important consideration when using maps, as they affect the accuracy and level of detail that can be represented on the map. It is important to choose the appropriate scale for the purpose of the map and the amount of detail needed.
The three most common forms are:
1 : 25,000
The number on the left of the is always the units of distance on the map
The number on the right is always the unit of distance on Earth’s surface
Every 1 inch on this map represents 25,000 actual inches on Earth’s surface.
“1 inch equals 1 mile”
Explains the relationship in words
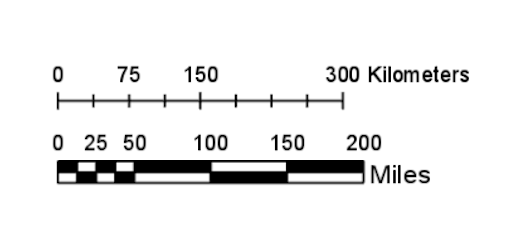
There is a bar line marked on the map to show how much actual distance is covered
: This is often used for navigation because it preserves angles, which is useful for plotting a straight-line course. However, it distorts the size of land masses near the poles, making them appear larger than they actually are.
: This is designed to show countries in their true relative size, with minimal distortion. However, it distorts shapes and distances, making it less suitable for navigation.
: This type of preserves the area of land masses, but distorts shape and distance.
The shape of an area can be distorted
Distance between two areas is inaccurate
The relative size of different areas is inaccurate
Direction can be distorted
Okay, so there’s a good reason why maps aren’t as big as the actual area they are depicting. But how does a flat, 2D map on a piece of paper accurately represent our spherical Earth?
Let’s talk about projections.
A is a way of representing the curved surface of the earth on a flat map. Because the earth is a three-dimensional sphere, it is not possible to create a completely accurate flat map of the earth without distorting some of its features. Projections are used to minimize these distortions as much as possible, depending on the purpose of the map and the characteristics of the region being mapped.
There are many different types of map projections, each with its own set of strengths and weaknesses. Some common types of projections include:
It is important to choose the appropriate for the purpose of the map and the characteristics of the region being mapped. No single can capture all aspects of the earth's surface accurately, so trade-offs are always necessary.
Depending on what the cartographer wants to focus on, they have these four choices to make sure the globe fits on a paper:
Two Important Types of Projections:
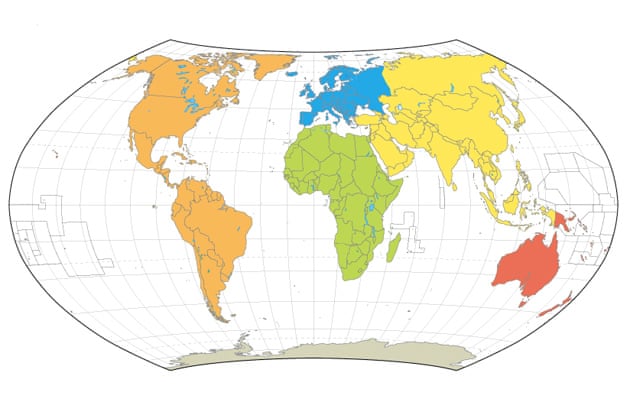
Robinson projection
The is a type of map that was developed in the 1960s by Arthur H. Robinson. It is a modified version of the , which is commonly used for navigation. The is designed to reduce some of the distortions of the , particularly near the poles, while still preserving some of its useful properties.
The is a compromise , meaning that it tries to balance out some of the distortions inherent in all map projections. It is not a perfect , and it still distorts the size, shape, and distance of land masses in various ways. However, it is generally considered to be a more visually appealing and useful than the for many purposes, such as world maps and atlases.
The is commonly used for world maps and other maps that aim to show the entire earth or a large region. It is not typically used for smaller-scale maps, such as street maps, because it distorts shapes and distances too much for such purposes.
+ used to focus on oceans
- land masses are smaller
Image Courtesy of The Guardian
Mercator projection
The is a widely used map that was first introduced by the Flemish geographer and cartographer Gerardus Mercator in 1569. It is a cylindrical in which the meridians (lines of ) and parallels (lines of ) are straight and perpendicular to each other, creating a grid-like pattern on the map.
One of the main characteristics of the is that it distorts the size of objects as the increases from the Equator to the poles. This means that objects near the poles, such as Greenland and Antarctica, appear much larger on a Mercator map than they actually are, while objects at the Equator appear smaller.
The is still widely used today, especially in online maps and navigation systems, because it is simple to construct and easy to use for activities such as plotting straight-line courses. However, it is not considered to be a particularly accurate representation of the Earth's surface, and other projections such as the or the Gall- have been developed to address this issue.
+ Accurate shape and direction
+ Map is rectangular
- Size of poles are distorted

Geographic Grid
There are imaginary grid patterns drawn on Earth’s surfaces that tell us specific locations.
Grid patterns are a type of spatial pattern that is characterized by a regular arrangement of objects or features in a grid-like structure. Grid patterns can be found in many different contexts, such as:
Urban planning: Many cities and towns are laid out on a grid pattern, with streets and blocks arranged in a regular pattern.
Agriculture: Some farming techniques, such as square foot gardening, involve planting crops in a grid pattern.
Landscaping: Grid patterns can be used in landscaping to create a formal, structured look.
Computer graphics: Grid patterns are commonly used in computer graphics to create structured backgrounds or to align objects.
Grid patterns are often used because they are simple and easy to understand, and they can be efficient in terms of the use of space. However, they can also be rigid and monotonous, and they may not always be the most aesthetically pleasing.
: arcs in circles around the LAP of the earth
Location of parallels is indicated by
→ LAT=LAP= horizontal
Your LAP is horizontal. So is horizontal.
Latitude
is a measure of the location of a place on the earth's surface, expressed in degrees north or south of the equator. The equator is the imaginary line that runs around the earth's middle, dividing it into the Northern Hemisphere and the Southern Hemisphere. is used, along with , to specify the absolute location of a place on the earth's surface.
is measured in degrees, with the equator being at 0° , the North Pole at 90° north (written as 90° N or +90°), and the South Pole at 90° south (written as 90° S or -90°). The of a place is usually expressed as a single number, ranging from -90° at the South Pole to +90° at the North Pole.
is important because it determines the distance of a place from the equator, which in turn affects its climate, vegetation, and other characteristics. is also used in navigation, as it can be used to determine the position of a place relative to the equator and the North Pole.
: arcs drawn from the North pole to the South pole
Location of meridians is indicated by
Meridian
A is an imaginary line on the earth's surface that runs from the North Pole to the South Pole. It is used to measure , which is the distance of a place east or west of the Prime . The Prime is an arbitrary reference point that has been established as the starting point for measuring , and it is defined as 0° .
Meridians are spaced evenly around the earth, with each being about 69 miles (111 kilometers) apart at the equator. There are a total of 360 meridians, representing the 360 degrees of . The International Date Line, which roughly follows a 180° , is the that marks the transition between one day and the next.
Meridians are important because they are used to determine the of a place and its time zone. They are also used in navigation, as they can be used to determine the position of a place relative to the Prime .
→ LONG= up and down
If something is long, it is vertical. So is vertical.
Longitude
is a measure of the location of a place on the earth's surface, expressed in degrees east or west of the Prime . The Prime is an imaginary line that runs from the North Pole to the South Pole, passing through the Royal Observatory in Greenwich, England. is used, along with , to specify the absolute location of a place on the earth's surface.
is measured in degrees, with the Prime being at 0° , and the International Date Line, which roughly follows a 180° , being at 180° (written as 180° E or 180° W). The of a place is usually expressed as a single number, ranging from -180° at the International Date Line to +180° at the Prime .
is important because it determines the distance of a place from the Prime , which in turn affects its time zone and the length of its day. is also used in navigation, as it can be used to determine the position of a place relative to the Prime .
🎥 Watch: AP HUG - Maps, Maps, Maps
Key Terms to Review (16)
Contemporary Maps
: Contemporary maps are current, up-to-date representations of geographical areas. They utilize modern technologies such as GPS and satellite imagery to provide accurate depictions of physical features, political boundaries, climate zones, etc.Early Maps
: Early maps are historical or ancient representations of the Earth's surface, often created by explorers or cartographers before the advent of modern technology. They were used for navigation and exploration purposes.Equal-area Projection
: An equal-area projection is a map that shows regions that are the same size on the Earth as they are on the map. This means all areas, whether countries, continents or oceans, have the same proportional relationship to their actual sizes on Earth.Geographic Grid
: The geographic grid refers to the system of imaginary lines (latitude and longitude) used to divide the surface of the Earth.Graphic Scale
: A graphic scale is a tool used on maps to represent the actual distance on the ground. It's a line marked with measurements, similar to a ruler, that helps users understand the size of features and distances between locations on a map.Latitude
: Latitude refers to geographic coordinates that specify north-south position relative to the equator on Earth’s surface.Longitude
: Longitude is the measurement of distance east or west of the Prime Meridian, which runs from the North Pole to the South Pole. It's expressed in degrees and helps determine a location's position on Earth.Map Scale
: Map scale refers to the relationship between distance on a map and the corresponding distance on the ground. It is usually represented as a ratio such as 1:10000 where 1 unit on the map equals 10,000 units on the ground.Mercator Projection
: The Mercator projection is a type of cylindrical map projection presented by Flemish geographer Gerardus Mercator in 1569. It preserves angles and shapes but distorts sizes, making landmasses near poles appear larger than they actually are.Meridian
: A meridian refers to a line of longitude, running from the North Pole to the South Pole and measuring distance east or west from the Prime Meridian.Parallel
: A parallel is a line of latitude on the Earth's surface, running east-west and measuring distance north or south from the equator.Peters Projection
: The Peters projection is a type of map that aims to represent all areas of equal size on the globe also as equal in size on the map. It distorts shapes but preserves sizes, especially in equatorial regions.Projection
: In geography, a projection is a method by which the curved surface of the earth is represented on a flat map.Ratio
: In geography, ratio refers to scale expressed as a numerical relationship between distance on the map and distance on the ground.Robinson Projection
: The Robinson projection is a compromise map projection showing the entire world at once. It displays both poles as lines rather than points and gives a realistic view of land masses near the equator.Written Scale
: This is another way to express scale on maps; instead of using numbers or ratios, it uses words to describe the relationship between a unit of length on the map and a unit of distance on the ground.1.1 Introduction to Maps and Types of Maps
8 min read•january 2, 2023
Sana Fatah
Riya Patel
Sana Fatah
Riya Patel
Early Maps vs Contemporary Maps
Map Scale and Projection
Have you ever seen a map the size of America? Or the size of the world? No? Then how are maps accurate if they are not the same size as the area they are representing? That’s where scaling comes into play.
A is a way to represent the relationship between distances on a map and the actual distances on the ground.
Map scales can vary greatly, depending on the size and purpose of the map. Large-scale maps, such as those used for city or street maps, have a small scale and show a lot of detail. Small-scale maps, such as world or regional maps, have a large scale and show less detail but cover a larger area.
Map scales are an important consideration when using maps, as they affect the accuracy and level of detail that can be represented on the map. It is important to choose the appropriate scale for the purpose of the map and the amount of detail needed.
The three most common forms are:
1 : 25,000
The number on the left of the is always the units of distance on the map
The number on the right is always the unit of distance on Earth’s surface
Every 1 inch on this map represents 25,000 actual inches on Earth’s surface.
“1 inch equals 1 mile”
Explains the relationship in words
There is a bar line marked on the map to show how much actual distance is covered
: This is often used for navigation because it preserves angles, which is useful for plotting a straight-line course. However, it distorts the size of land masses near the poles, making them appear larger than they actually are.
: This is designed to show countries in their true relative size, with minimal distortion. However, it distorts shapes and distances, making it less suitable for navigation.
: This type of preserves the area of land masses, but distorts shape and distance.
The shape of an area can be distorted
Distance between two areas is inaccurate
The relative size of different areas is inaccurate
Direction can be distorted
Okay, so there’s a good reason why maps aren’t as big as the actual area they are depicting. But how does a flat, 2D map on a piece of paper accurately represent our spherical Earth?
Let’s talk about projections.
A is a way of representing the curved surface of the earth on a flat map. Because the earth is a three-dimensional sphere, it is not possible to create a completely accurate flat map of the earth without distorting some of its features. Projections are used to minimize these distortions as much as possible, depending on the purpose of the map and the characteristics of the region being mapped.
There are many different types of map projections, each with its own set of strengths and weaknesses. Some common types of projections include:
It is important to choose the appropriate for the purpose of the map and the characteristics of the region being mapped. No single can capture all aspects of the earth's surface accurately, so trade-offs are always necessary.
Depending on what the cartographer wants to focus on, they have these four choices to make sure the globe fits on a paper:
Two Important Types of Projections:
Robinson projection
The is a type of map that was developed in the 1960s by Arthur H. Robinson. It is a modified version of the , which is commonly used for navigation. The is designed to reduce some of the distortions of the , particularly near the poles, while still preserving some of its useful properties.
The is a compromise , meaning that it tries to balance out some of the distortions inherent in all map projections. It is not a perfect , and it still distorts the size, shape, and distance of land masses in various ways. However, it is generally considered to be a more visually appealing and useful than the for many purposes, such as world maps and atlases.
The is commonly used for world maps and other maps that aim to show the entire earth or a large region. It is not typically used for smaller-scale maps, such as street maps, because it distorts shapes and distances too much for such purposes.
+ used to focus on oceans
- land masses are smaller
Image Courtesy of The Guardian
Mercator projection
The is a widely used map that was first introduced by the Flemish geographer and cartographer Gerardus Mercator in 1569. It is a cylindrical in which the meridians (lines of ) and parallels (lines of ) are straight and perpendicular to each other, creating a grid-like pattern on the map.
One of the main characteristics of the is that it distorts the size of objects as the increases from the Equator to the poles. This means that objects near the poles, such as Greenland and Antarctica, appear much larger on a Mercator map than they actually are, while objects at the Equator appear smaller.
The is still widely used today, especially in online maps and navigation systems, because it is simple to construct and easy to use for activities such as plotting straight-line courses. However, it is not considered to be a particularly accurate representation of the Earth's surface, and other projections such as the or the Gall- have been developed to address this issue.
+ Accurate shape and direction
+ Map is rectangular
- Size of poles are distorted
Geographic Grid
There are imaginary grid patterns drawn on Earth’s surfaces that tell us specific locations.
Grid patterns are a type of spatial pattern that is characterized by a regular arrangement of objects or features in a grid-like structure. Grid patterns can be found in many different contexts, such as:
Urban planning: Many cities and towns are laid out on a grid pattern, with streets and blocks arranged in a regular pattern.
Agriculture: Some farming techniques, such as square foot gardening, involve planting crops in a grid pattern.
Landscaping: Grid patterns can be used in landscaping to create a formal, structured look.
Computer graphics: Grid patterns are commonly used in computer graphics to create structured backgrounds or to align objects.
Grid patterns are often used because they are simple and easy to understand, and they can be efficient in terms of the use of space. However, they can also be rigid and monotonous, and they may not always be the most aesthetically pleasing.
: arcs in circles around the LAP of the earth
Location of parallels is indicated by
→ LAT=LAP= horizontal
Your LAP is horizontal. So is horizontal.
Latitude
is a measure of the location of a place on the earth's surface, expressed in degrees north or south of the equator. The equator is the imaginary line that runs around the earth's middle, dividing it into the Northern Hemisphere and the Southern Hemisphere. is used, along with , to specify the absolute location of a place on the earth's surface.
is measured in degrees, with the equator being at 0° , the North Pole at 90° north (written as 90° N or +90°), and the South Pole at 90° south (written as 90° S or -90°). The of a place is usually expressed as a single number, ranging from -90° at the South Pole to +90° at the North Pole.
is important because it determines the distance of a place from the equator, which in turn affects its climate, vegetation, and other characteristics. is also used in navigation, as it can be used to determine the position of a place relative to the equator and the North Pole.
: arcs drawn from the North pole to the South pole
Location of meridians is indicated by
Meridian
A is an imaginary line on the earth's surface that runs from the North Pole to the South Pole. It is used to measure , which is the distance of a place east or west of the Prime . The Prime is an arbitrary reference point that has been established as the starting point for measuring , and it is defined as 0° .
Meridians are spaced evenly around the earth, with each being about 69 miles (111 kilometers) apart at the equator. There are a total of 360 meridians, representing the 360 degrees of . The International Date Line, which roughly follows a 180° , is the that marks the transition between one day and the next.
Meridians are important because they are used to determine the of a place and its time zone. They are also used in navigation, as they can be used to determine the position of a place relative to the Prime .
→ LONG= up and down
If something is long, it is vertical. So is vertical.
Longitude
is a measure of the location of a place on the earth's surface, expressed in degrees east or west of the Prime . The Prime is an imaginary line that runs from the North Pole to the South Pole, passing through the Royal Observatory in Greenwich, England. is used, along with , to specify the absolute location of a place on the earth's surface.
is measured in degrees, with the Prime being at 0° , and the International Date Line, which roughly follows a 180° , being at 180° (written as 180° E or 180° W). The of a place is usually expressed as a single number, ranging from -180° at the International Date Line to +180° at the Prime .
is important because it determines the distance of a place from the Prime , which in turn affects its time zone and the length of its day. is also used in navigation, as it can be used to determine the position of a place relative to the Prime .
🎥 Watch: AP HUG - Maps, Maps, Maps
Key Terms to Review (16)
Contemporary Maps
: Contemporary maps are current, up-to-date representations of geographical areas. They utilize modern technologies such as GPS and satellite imagery to provide accurate depictions of physical features, political boundaries, climate zones, etc.Early Maps
: Early maps are historical or ancient representations of the Earth's surface, often created by explorers or cartographers before the advent of modern technology. They were used for navigation and exploration purposes.Equal-area Projection
: An equal-area projection is a map that shows regions that are the same size on the Earth as they are on the map. This means all areas, whether countries, continents or oceans, have the same proportional relationship to their actual sizes on Earth.Geographic Grid
: The geographic grid refers to the system of imaginary lines (latitude and longitude) used to divide the surface of the Earth.Graphic Scale
: A graphic scale is a tool used on maps to represent the actual distance on the ground. It's a line marked with measurements, similar to a ruler, that helps users understand the size of features and distances between locations on a map.Latitude
: Latitude refers to geographic coordinates that specify north-south position relative to the equator on Earth’s surface.Longitude
: Longitude is the measurement of distance east or west of the Prime Meridian, which runs from the North Pole to the South Pole. It's expressed in degrees and helps determine a location's position on Earth.Map Scale
: Map scale refers to the relationship between distance on a map and the corresponding distance on the ground. It is usually represented as a ratio such as 1:10000 where 1 unit on the map equals 10,000 units on the ground.Mercator Projection
: The Mercator projection is a type of cylindrical map projection presented by Flemish geographer Gerardus Mercator in 1569. It preserves angles and shapes but distorts sizes, making landmasses near poles appear larger than they actually are.Meridian
: A meridian refers to a line of longitude, running from the North Pole to the South Pole and measuring distance east or west from the Prime Meridian.Parallel
: A parallel is a line of latitude on the Earth's surface, running east-west and measuring distance north or south from the equator.Peters Projection
: The Peters projection is a type of map that aims to represent all areas of equal size on the globe also as equal in size on the map. It distorts shapes but preserves sizes, especially in equatorial regions.Projection
: In geography, a projection is a method by which the curved surface of the earth is represented on a flat map.Ratio
: In geography, ratio refers to scale expressed as a numerical relationship between distance on the map and distance on the ground.Robinson Projection
: The Robinson projection is a compromise map projection showing the entire world at once. It displays both poles as lines rather than points and gives a realistic view of land masses near the equator.Written Scale
: This is another way to express scale on maps; instead of using numbers or ratios, it uses words to describe the relationship between a unit of length on the map and a unit of distance on the ground.Resources
© 2024 Fiveable Inc. All rights reserved.
AP® and SAT® are trademarks registered by the College Board, which is not affiliated with, and does not endorse this website.