6.2 Energy Diagrams of Reactions
8 min read•april 6, 2023
Anika P
Dalia Savy
Riya Patel
Anika P
Dalia Savy
Riya Patel
Introduction
, also known as , can be used to represent the energy changes that occur during a chemical reaction. These diagrams show the potential energy of the and , as well as the required for the reaction to occur. The diagrams also indicate whether a reaction is endothermic or exothermic by showing the change in potential energy between the and .
The energy diagram for an typically shows a decrease in potential energy as the are converted to . This indicates that energy is released by the system during the reaction.
The energy diagram for an typically shows an increase in potential energy as the are converted to . This indicates that energy is absorbed by the system during the reaction.
The is represented by the highest point on the energy diagram. It is the energy required to overcome the energy barrier between the and , and it is supplied by the system or surroundings depending on the type of reaction.
Overall, are a useful tool for understanding the energy changes that occur during chemical reactions. They can help to visualize the potential energy of the and , the required for the reaction to occur, and whether the reaction is endothermic or exothermic.
Review
, represented by ΔH, is a measure of the heat energy involved in a chemical reaction. It is defined as the change in the internal energy of a system, plus the work done by the system on its surroundings. If the of the is lower than the of the , the reaction is exothermic and heat is released from the system. If the of the is higher than the of the , the reaction is endothermic and heat is absorbed by the system. Understanding the of a reaction can help to predict the direction of a reaction, the amount of heat absorbed or released, and the potential for a reaction to be spontaneous or non-spontaneous.
Phase Changes
can also be exothermic or endothermic. Exothermic , such as , release heat energy to the surroundings as the substance changes from a liquid to a solid. Endothermic , such as , absorb heat energy from the surroundings as the substance changes from a solid to a liquid. Similarly, exothermic , such as , release heat energy to the surroundings as the substance changes from a gas to a liquid. Endothermic , such as evaporation, absorb heat energy from the surroundings as the substance changes from a liquid to a gas. Physical or chemical processes can be described through , which show the change in potential energy of the substance as it changes phase and the heat absorbed or released during the process.
It's important to note that during , the energy that is either absorbed or released is known as which is heat energy that is absorbed or released by a substance during a phase change, without a change in temperature.
Melting
The process of , H2O(s) →H2O(l) is an endothermic process. The energy is absorbed by the system in the form of heat to change the solid phase of water (ice) to the liquid phase of water. So, the heat is going into the system to raise the temperature of the ice to its point, which is 0 °C (273 K) at atmospheric pressure. This process requires heat energy and the system is absorbing it, so it is endothermic.
Condensation
The process of , H2O(g) → H2O(l), is an exothermic process. The energy is released by the system in the form of heat to change the gas phase of water to the liquid phase of water. So, the heat is released by the system as the temperature of the water vapor decrease to its point, which is dependent on the pressure and temperature. The process releases heat energy and the system is releasing it, so it is exothermic.
To summarize, is the opposite of boiling, and boiling is an endothermic process that requires energy/heat to happen. Therefore, is an exothermic process that releases energy (from the system out to the surroundings).
Overview
| Phase Change | Reaction | Process |
| Solid → Liquid | Endothermic | |
| Liquid → Gas | Endothermic | |
| Solid → Gas | Endothermic | |
| Gas → Liquid | Exothermic | |
| Liquid → Solid | Exothermic | |
| Gas → Solid | Exothermic |
Energy Diagrams
are graphical representations that show the changes in energy that occur during a chemical or physical process. They are often used to illustrate the energy changes that occur during a reaction or phase change.
In an energy diagram, the vertical axis represents the energy, and the horizontal axis represents the progress of the reaction or phase change. The energy diagram for an endothermic process will have an upward slope, indicating that energy is being absorbed by the system as the reaction or phase change proceeds. The energy diagram for an exothermic process will have a downward slope, indicating that energy is being released by the system as the reaction or phase change proceeds.
It's important to note that the are theoretical tools, they are not always real representation of the energy changes during the process. Also, it's important to remember that the show the changes in the internal energy of the system and not the heat or work interactions with the surroundings.
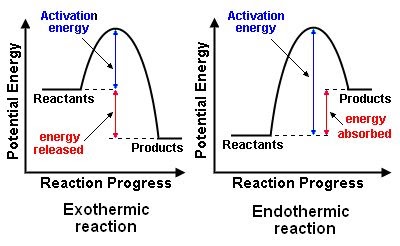
Image Courtesy of Pinterest
: refers to the potential energy of the at the beginning of the reaction before any energy is added or released. : refers to the potential energy of the at the end of the reaction after all the energy has been added or released.
: is the minimum amount of energy required to initiate a chemical reaction. It represents the amount of energy required to overcome the initial barriers that prevent the from reacting.
: is a hypothetical intermediate state that a molecule must pass through before it can react. It is the highest point on the energy diagram, representing the most unstable state of the before they transform into . The reaction occurs when the energy supplied to the exceeds the and the system reaches the .
Exothermic Reactions
In the energy diagram for an , the potential energy of the is lower than that of the . This indicates that energy has been released from the system, as the have converted to .
The is also lower, which means that less energy is required to initiate the reaction. The energy required to overcome the is supplied by the system, which results in the release of energy in the form of heat.
The energy difference between the and the is represented by the change in (ΔH). In an , the difference is negative, which means that energy has been released by the system.
Overall, in an , the energy of the is lower than the , which means that energy has been released by the system, and the reaction is exothermic.
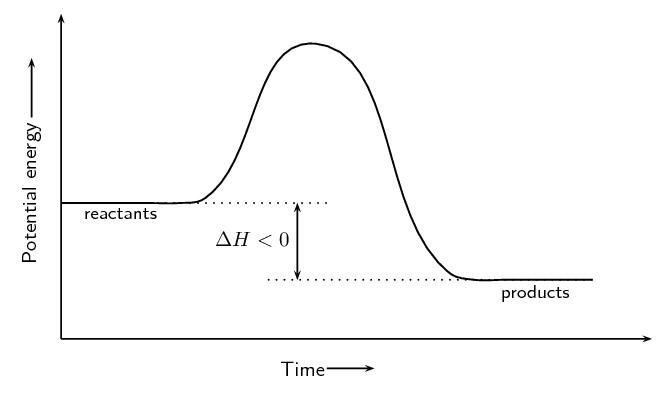
Image Courtesy of SilaVula
Endothermic Reactions
In the energy diagram for an , the potential energy of the is higher than that of the . This indicates that energy has been absorbed by the system, as the have converted to .
The is also higher, which means that more energy is required to initiate the reaction. The energy required to overcome the is supplied by the surroundings, which results in the absorption of energy in the form of heat.
The energy difference between the and the is represented by the change in (ΔH). In an , the difference is positive, which means that energy has been absorbed by the system.
Overall, in an , the energy of the is higher than the , which means that energy has been absorbed by the system, and the reaction is endothermic.
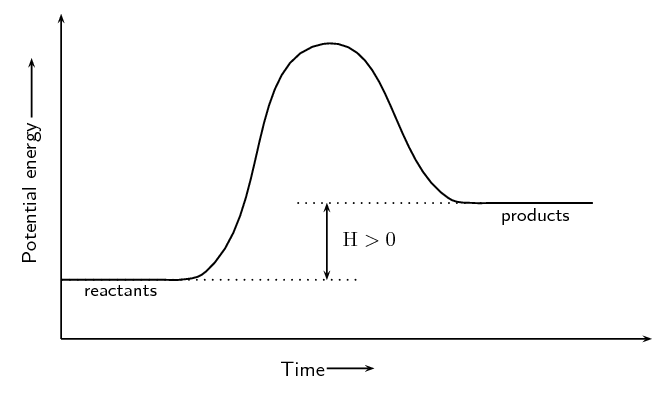
Image Courtesy of SilaVula
Example
Now that you've seen the graph and been introduced to a few terms, let's put the two together and do a practice problem.
Image Courtesy of Socratic
(a) What is the potential energy of the ?
Just look at the y-axis for the : 40 kJ!
(b) What is the potential energy of the ?
Similar to part a, just look at the y-axis for the : 20 kJ.
(c) What is the value of ΔH?
ΔH is the difference between the potential energy of the and the potential energy of the .
Simply do: () - ()
(20 kJ) - (40 kJ) = -20 kJ
In other words, 20 kJ of energy is released during this reaction.
(d) What is the ?
To find the , you should be looking for two numbers: the potential energy of the and the energy of the (the maximum point).
(energy of activation complex) - ()
(100 kJ) - (40 kJ) = 60 kJ
In other words, it takes 60 kJ of energy to complete the reaction.
(e) Is this an endothermic or ?
Since ΔH is negative and the potential energy of the is lower than that of the , this is an .
Key Terms to Review (19)
Activated Complex
: This is an unstable arrangement of atoms that exists momentarily at the peak of the activation-energy barrier during a chemical reaction. It's the state of transition between reactants and products.Activation Energy
: Activation Energy is defined as the minimum amount of energy required to initiate or start up a chemical reaction.Condensation
: Condensation is the process where a gas turns into a liquid due to a decrease in temperature or pressure.Deposition
: Deposition refers to the phase transition where gas transforms directly into solid without passing through the liquid phase.Endothermic Reaction
: An endothermic reaction is one that absorbs heat from its surroundings. In this process, more heat goes into breaking bonds in reactants than gets released when new bonds form in products.Energy Diagrams
: Energy diagrams are graphical representations that illustrate the energy changes during a chemical reaction. They show the potential energy of a system as it progresses from reactants to products.Enthalpy
: Enthalpy is a measure of total energy in a thermodynamic system. It includes internal energy which can be used for work and volume expansion against an external pressure.Exothermic Reaction
: An exothermic reaction is a chemical reaction that releases energy by light or heat. It is the opposite of an endothermic reaction.Freezing
: Freezing is the process in which a substance changes from a liquid to a solid state, usually as a result of temperature decrease.Latent Heat
: Latent heat is the energy absorbed or released by a substance during a phase change, such as melting or boiling, that occurs without changing its temperature.Melting
: Melting is the process where a solid turns into a liquid due to an increase in temperature or pressure.PEproducts
: PEproducts refers to the potential energy of products after undergoing a chemical reaction.PEreactants
: PEreactants refers to the potential energy of reactants in a chemical reaction. It's essentially the stored energy that reactants have before they undergo a reaction.Phase Changes
: Phase changes refer to the transition of matter from one state (solid, liquid, gas) to another. These changes occur when heat (energy) is added or removed.Potential Energy Diagrams
: Potential Energy Diagrams are specific types of energy diagrams that show how potential energy changes over time during a chemical process or physical change.Products
: In a chemical reaction, products are the substances that are formed as a result of the reaction.Reactants
: Reactants are substances that start a chemical reaction. They interact with each other to form new substances called products.Sublimation
: Sublimation is the process in which a substance changes from a solid to a gas without passing through the liquid state.Vaporization / Boiling
: Vaporization or boiling is when a liquid turns into gas due to increase in temperature or pressure changes.6.2 Energy Diagrams of Reactions
8 min read•april 6, 2023
Anika P
Dalia Savy
Riya Patel
Anika P
Dalia Savy
Riya Patel
Introduction
, also known as , can be used to represent the energy changes that occur during a chemical reaction. These diagrams show the potential energy of the and , as well as the required for the reaction to occur. The diagrams also indicate whether a reaction is endothermic or exothermic by showing the change in potential energy between the and .
The energy diagram for an typically shows a decrease in potential energy as the are converted to . This indicates that energy is released by the system during the reaction.
The energy diagram for an typically shows an increase in potential energy as the are converted to . This indicates that energy is absorbed by the system during the reaction.
The is represented by the highest point on the energy diagram. It is the energy required to overcome the energy barrier between the and , and it is supplied by the system or surroundings depending on the type of reaction.
Overall, are a useful tool for understanding the energy changes that occur during chemical reactions. They can help to visualize the potential energy of the and , the required for the reaction to occur, and whether the reaction is endothermic or exothermic.
Review
, represented by ΔH, is a measure of the heat energy involved in a chemical reaction. It is defined as the change in the internal energy of a system, plus the work done by the system on its surroundings. If the of the is lower than the of the , the reaction is exothermic and heat is released from the system. If the of the is higher than the of the , the reaction is endothermic and heat is absorbed by the system. Understanding the of a reaction can help to predict the direction of a reaction, the amount of heat absorbed or released, and the potential for a reaction to be spontaneous or non-spontaneous.
Phase Changes
can also be exothermic or endothermic. Exothermic , such as , release heat energy to the surroundings as the substance changes from a liquid to a solid. Endothermic , such as , absorb heat energy from the surroundings as the substance changes from a solid to a liquid. Similarly, exothermic , such as , release heat energy to the surroundings as the substance changes from a gas to a liquid. Endothermic , such as evaporation, absorb heat energy from the surroundings as the substance changes from a liquid to a gas. Physical or chemical processes can be described through , which show the change in potential energy of the substance as it changes phase and the heat absorbed or released during the process.
It's important to note that during , the energy that is either absorbed or released is known as which is heat energy that is absorbed or released by a substance during a phase change, without a change in temperature.
Melting
The process of , H2O(s) →H2O(l) is an endothermic process. The energy is absorbed by the system in the form of heat to change the solid phase of water (ice) to the liquid phase of water. So, the heat is going into the system to raise the temperature of the ice to its point, which is 0 °C (273 K) at atmospheric pressure. This process requires heat energy and the system is absorbing it, so it is endothermic.
Condensation
The process of , H2O(g) → H2O(l), is an exothermic process. The energy is released by the system in the form of heat to change the gas phase of water to the liquid phase of water. So, the heat is released by the system as the temperature of the water vapor decrease to its point, which is dependent on the pressure and temperature. The process releases heat energy and the system is releasing it, so it is exothermic.
To summarize, is the opposite of boiling, and boiling is an endothermic process that requires energy/heat to happen. Therefore, is an exothermic process that releases energy (from the system out to the surroundings).
Overview
| Phase Change | Reaction | Process |
| Solid → Liquid | Endothermic | |
| Liquid → Gas | Endothermic | |
| Solid → Gas | Endothermic | |
| Gas → Liquid | Exothermic | |
| Liquid → Solid | Exothermic | |
| Gas → Solid | Exothermic |
Energy Diagrams
are graphical representations that show the changes in energy that occur during a chemical or physical process. They are often used to illustrate the energy changes that occur during a reaction or phase change.
In an energy diagram, the vertical axis represents the energy, and the horizontal axis represents the progress of the reaction or phase change. The energy diagram for an endothermic process will have an upward slope, indicating that energy is being absorbed by the system as the reaction or phase change proceeds. The energy diagram for an exothermic process will have a downward slope, indicating that energy is being released by the system as the reaction or phase change proceeds.
It's important to note that the are theoretical tools, they are not always real representation of the energy changes during the process. Also, it's important to remember that the show the changes in the internal energy of the system and not the heat or work interactions with the surroundings.
Image Courtesy of Pinterest
: refers to the potential energy of the at the beginning of the reaction before any energy is added or released. : refers to the potential energy of the at the end of the reaction after all the energy has been added or released.
: is the minimum amount of energy required to initiate a chemical reaction. It represents the amount of energy required to overcome the initial barriers that prevent the from reacting.
: is a hypothetical intermediate state that a molecule must pass through before it can react. It is the highest point on the energy diagram, representing the most unstable state of the before they transform into . The reaction occurs when the energy supplied to the exceeds the and the system reaches the .
Exothermic Reactions
In the energy diagram for an , the potential energy of the is lower than that of the . This indicates that energy has been released from the system, as the have converted to .
The is also lower, which means that less energy is required to initiate the reaction. The energy required to overcome the is supplied by the system, which results in the release of energy in the form of heat.
The energy difference between the and the is represented by the change in (ΔH). In an , the difference is negative, which means that energy has been released by the system.
Overall, in an , the energy of the is lower than the , which means that energy has been released by the system, and the reaction is exothermic.
Image Courtesy of SilaVula
Endothermic Reactions
In the energy diagram for an , the potential energy of the is higher than that of the . This indicates that energy has been absorbed by the system, as the have converted to .
The is also higher, which means that more energy is required to initiate the reaction. The energy required to overcome the is supplied by the surroundings, which results in the absorption of energy in the form of heat.
The energy difference between the and the is represented by the change in (ΔH). In an , the difference is positive, which means that energy has been absorbed by the system.
Overall, in an , the energy of the is higher than the , which means that energy has been absorbed by the system, and the reaction is endothermic.
Image Courtesy of SilaVula
Example
Now that you've seen the graph and been introduced to a few terms, let's put the two together and do a practice problem.
Image Courtesy of Socratic
(a) What is the potential energy of the ?
Just look at the y-axis for the : 40 kJ!
(b) What is the potential energy of the ?
Similar to part a, just look at the y-axis for the : 20 kJ.
(c) What is the value of ΔH?
ΔH is the difference between the potential energy of the and the potential energy of the .
Simply do: () - ()
(20 kJ) - (40 kJ) = -20 kJ
In other words, 20 kJ of energy is released during this reaction.
(d) What is the ?
To find the , you should be looking for two numbers: the potential energy of the and the energy of the (the maximum point).
(energy of activation complex) - ()
(100 kJ) - (40 kJ) = 60 kJ
In other words, it takes 60 kJ of energy to complete the reaction.
(e) Is this an endothermic or ?
Since ΔH is negative and the potential energy of the is lower than that of the , this is an .
Key Terms to Review (19)
Activated Complex
: This is an unstable arrangement of atoms that exists momentarily at the peak of the activation-energy barrier during a chemical reaction. It's the state of transition between reactants and products.Activation Energy
: Activation Energy is defined as the minimum amount of energy required to initiate or start up a chemical reaction.Condensation
: Condensation is the process where a gas turns into a liquid due to a decrease in temperature or pressure.Deposition
: Deposition refers to the phase transition where gas transforms directly into solid without passing through the liquid phase.Endothermic Reaction
: An endothermic reaction is one that absorbs heat from its surroundings. In this process, more heat goes into breaking bonds in reactants than gets released when new bonds form in products.Energy Diagrams
: Energy diagrams are graphical representations that illustrate the energy changes during a chemical reaction. They show the potential energy of a system as it progresses from reactants to products.Enthalpy
: Enthalpy is a measure of total energy in a thermodynamic system. It includes internal energy which can be used for work and volume expansion against an external pressure.Exothermic Reaction
: An exothermic reaction is a chemical reaction that releases energy by light or heat. It is the opposite of an endothermic reaction.Freezing
: Freezing is the process in which a substance changes from a liquid to a solid state, usually as a result of temperature decrease.Latent Heat
: Latent heat is the energy absorbed or released by a substance during a phase change, such as melting or boiling, that occurs without changing its temperature.Melting
: Melting is the process where a solid turns into a liquid due to an increase in temperature or pressure.PEproducts
: PEproducts refers to the potential energy of products after undergoing a chemical reaction.PEreactants
: PEreactants refers to the potential energy of reactants in a chemical reaction. It's essentially the stored energy that reactants have before they undergo a reaction.Phase Changes
: Phase changes refer to the transition of matter from one state (solid, liquid, gas) to another. These changes occur when heat (energy) is added or removed.Potential Energy Diagrams
: Potential Energy Diagrams are specific types of energy diagrams that show how potential energy changes over time during a chemical process or physical change.Products
: In a chemical reaction, products are the substances that are formed as a result of the reaction.Reactants
: Reactants are substances that start a chemical reaction. They interact with each other to form new substances called products.Sublimation
: Sublimation is the process in which a substance changes from a solid to a gas without passing through the liquid state.Vaporization / Boiling
: Vaporization or boiling is when a liquid turns into gas due to increase in temperature or pressure changes.Resources
© 2024 Fiveable Inc. All rights reserved.
AP® and SAT® are trademarks registered by the College Board, which is not affiliated with, and does not endorse this website.